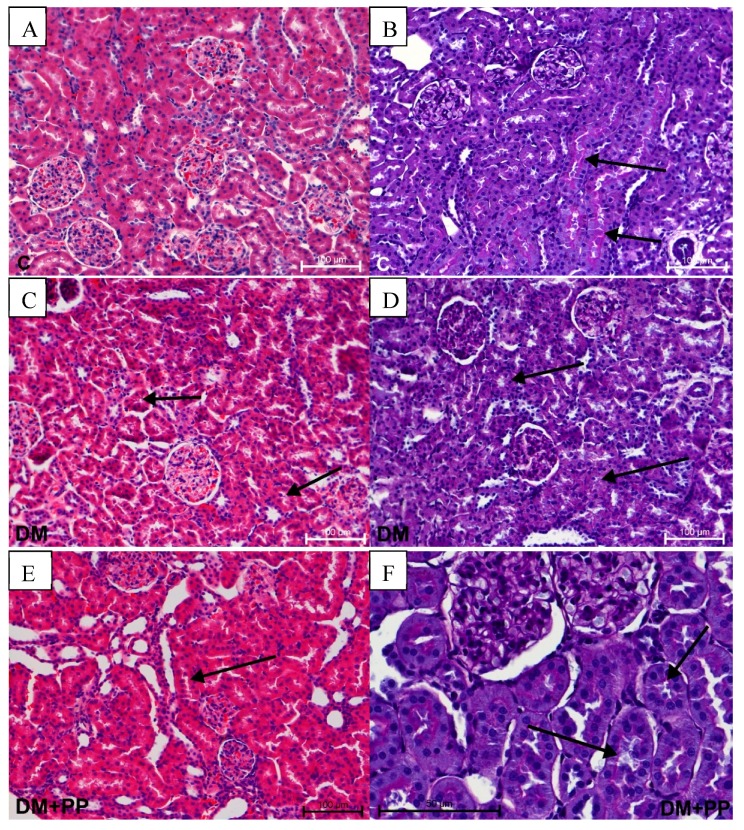
Figure 7.
Histopathological studies of Blue Congo extract on the kidney tissue of STZ-induced diabetic rats. Note the presence of increased diuresis in proximal tubules (arrows) in the DM and DM + PP group photos on the left side (C,E). Different PAS-positive reaction (pink color) in proximal tubules (arrows), distal tubules, and capillary tuft (D,F). Photos on left side stained with H&E, magnification 200× (A,C,E); photos on right side show PAS-positive staining, magnification 200× (B,D), magnification 400× (F). C—control rats (healthy rats), DM—diabetic rats, DM + PP—diabetic rats treated with Blue Congo extract for 14 days (at a dose of 165 mg/kg b.w./day).

