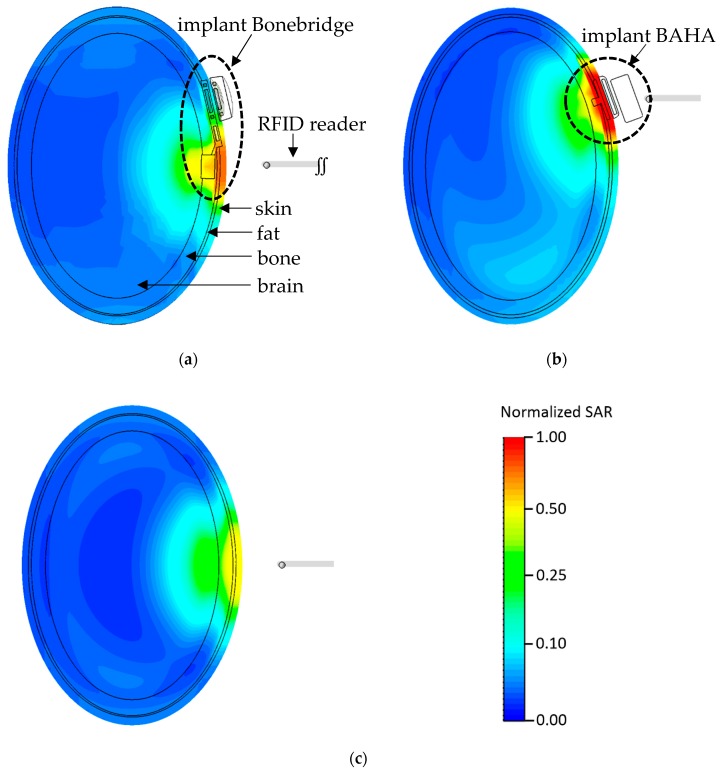
Figure 4.
The distribution of localized SAR (at frontal cross-section through the center of the implant part fixed to the bones of the skull) simulated by CST Studio Suite, under exposure to EMF from an RFID HF reader (13.56 MHz) in exposure scenario c, as shown in Figure 2: (a) near a Bonebridge implant, (b) near a BAHA implant and (c) in a non-user (unified normalized logarithmic color scale of absolute SAR values—reference value: maximum localized SAR value calculated for exposure scenario c and BAHA implant user).

