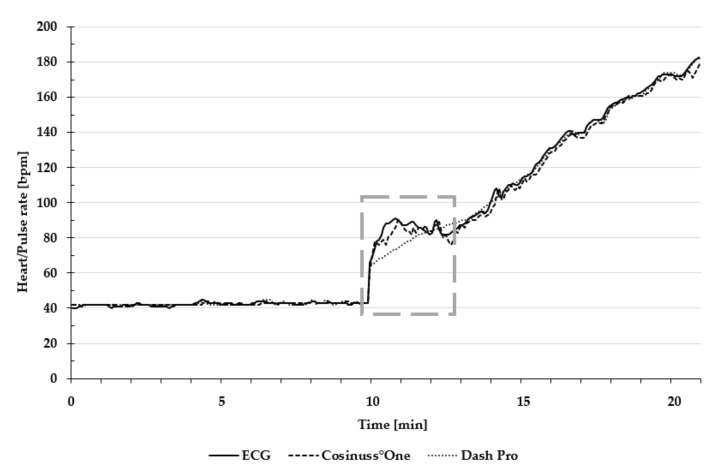
Figure 3.
Exemplary presentation of pulse and heart rate during the entire test protocol. The dashed frame indicates the change from lying position to cycling. Heart rate of the ECG is depicted as a solid line; the pulse rate of Cosinuss°One is depicted as the dashed line; and the pulse rate of Dash Pro is depicted as the dotted line.

