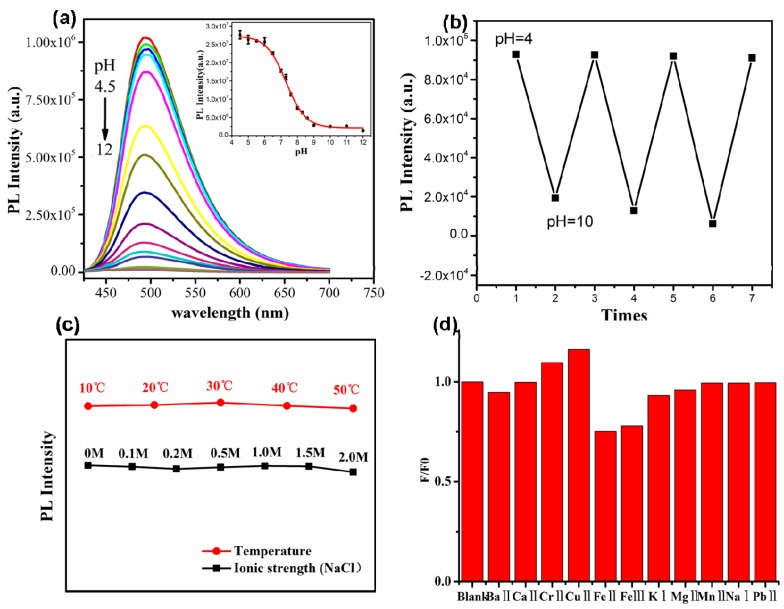
Figure 3.
(a) The PL spectra of CDs as the pH increases from 4.5 to 12, excited at 400 nm. The inset displays sigmoidal fitting of pH-dependent fluorescence intensity. (b) PL intensity of CDs upon cycling the pH value seven times between 4 and 10. (c) PL relative intensity of CDs at different temperatures and NaCl solution with various concentrations. (d) The response of the CDs in various metal ions with a concentration of 0.5 mM.

