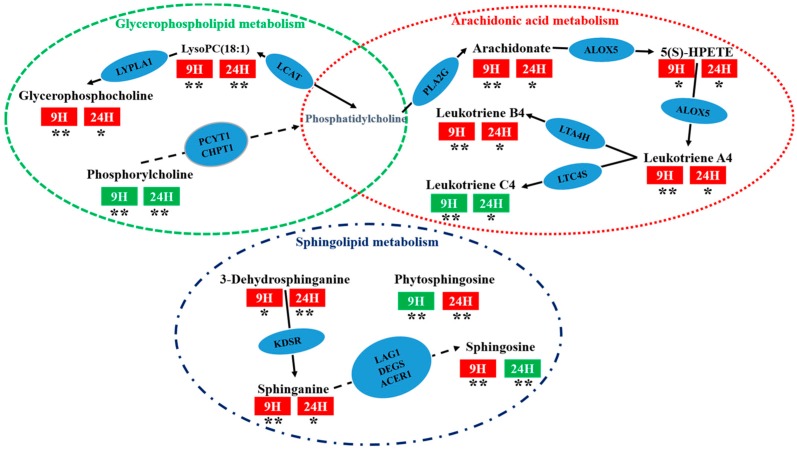
Figure 8.
The metabolic pathway networks of particularly significant potential biomarkers for the therapeutic effect of p-b4 on MSU crystal-induced GA rats. The word in blue ovals means enzyme according to KEGG pathway database; the word in red and green rectangles means the sampling time of serum; red indicates an up-regulation of metabolites and green indicates a down-regulation of metabolites (GA model group VS P-b4 group); * means p < 0.05, ** means p < 0.01.

