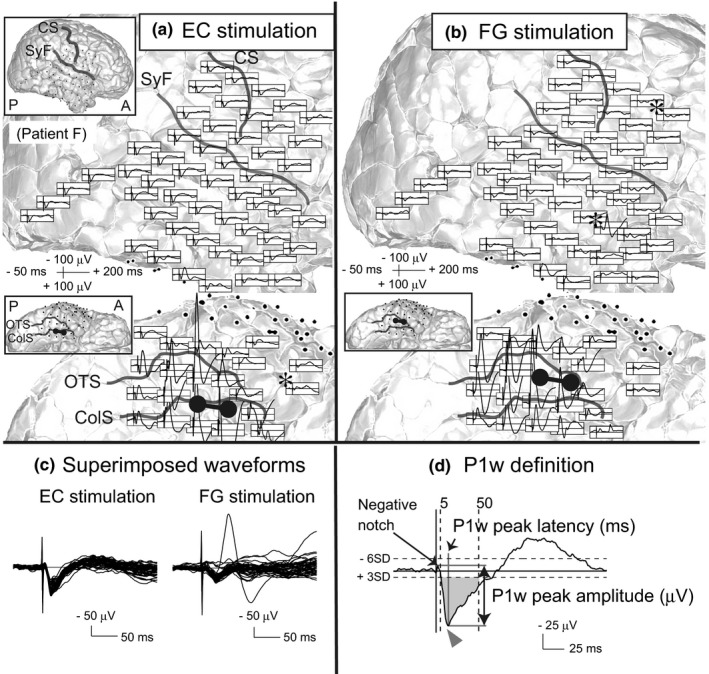
Figure 2.

Representative cortico‐cortical evoked potential (CCEP) waveforms and P1w definition. (a,b) CCEPs evoked by EC (a) and FG (b) stimulation in a representative case (patient F). CCEPs (black waveforms) are plotted on a 3D MRI. The left upper panel in each brain map shows the whole 3D MRI to facilitate an understanding of the electrode configuration. The vertical line corresponds to the time of stimulation. In the 3D MRI, each stimulus site is illustrated by a pair of interconnected black electrodes. Electrodes that recorded local maxima of remote isolated fields are marked by asterisks (*). (c) Superimposed CCEP waveforms of lateral surface electrodes. Note that CCEPs by EC stimulation are more uniform than those by FG stimulation. (d) P1w definition. Representative CCEP evoked by EC stimulation in patient D (recorded from the primary somatosensory cortex). The arrowheads indicate P1w peaks. The area shaded in gray indicates the inclusion criteria for P1w as defined in Section 2. Peak latency must be between +5 and +50 ms, and peak amplitude must exceed three SD of baseline activity. ColS, collateral sulcus; CS, central sulcus; EC, entorhinal cortex; FG, fusiform gyrus; OTS, occipito‐temporal sulcus; SyF, Sylvian fissure
