
Figure 3.
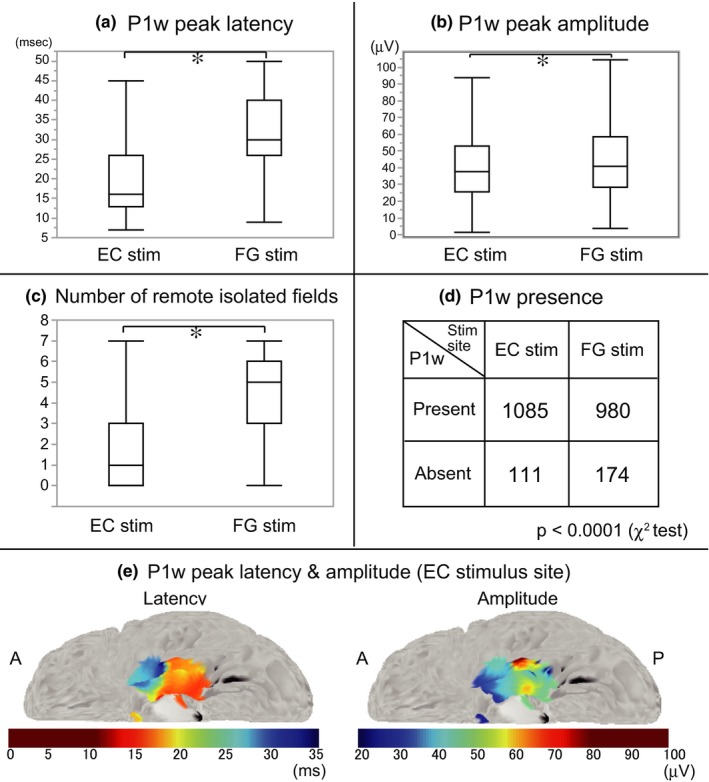
Comparison of P1w indices and the number of remote isolated fields for EC and FG stimulation, and contour map of P1w indices in MNI standard space. (a–c) The box plots show the results of P1w peak latency (a), P1w peak amplitude (b), and the number of remote isolated fields (c). *p < .05, EC versus FG stimulation, Mann–Whitney test. (d) P1w presence after EC and FG stimulation. The number of P1w‐present electrodes was significantly larger in EC compared to FG stimulation (p < .0001, χ 2 test). (e) Contour map of P1w peak latency and amplitude averaged across all patients. P1w indices are plotted on the left EC stimulus sites for display purposes. The upper and lower limits of the color scale are defined according to the maximum and minimum values of P1w indices in box plots of Figure 3a,b