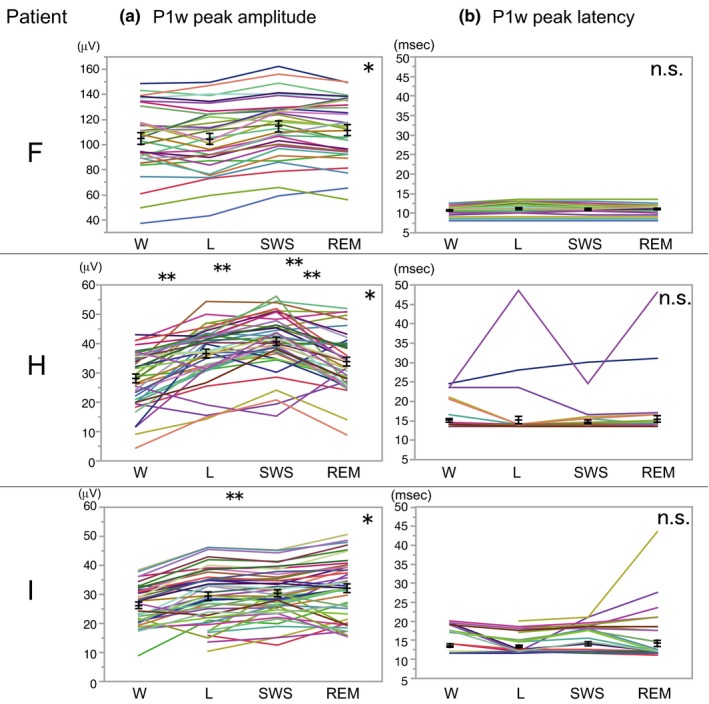
Figure 4.

Cortico‐cortical evoked potential modulation during sleep. (a) P1w peak amplitude variations at different sleep stages in patients F, H, and I. *p < .0001, repeated‐measure ANOVA for each patient; **p < .05, Tukey–Kramer HSD post hoc analysis. (b) P1w peak latency did not change at different sleep stages. L, light sleep; REM, REM sleep; SWS, slow‐wave sleep; W, awake. Black lines: mean ± standard error
