
Figure 5.
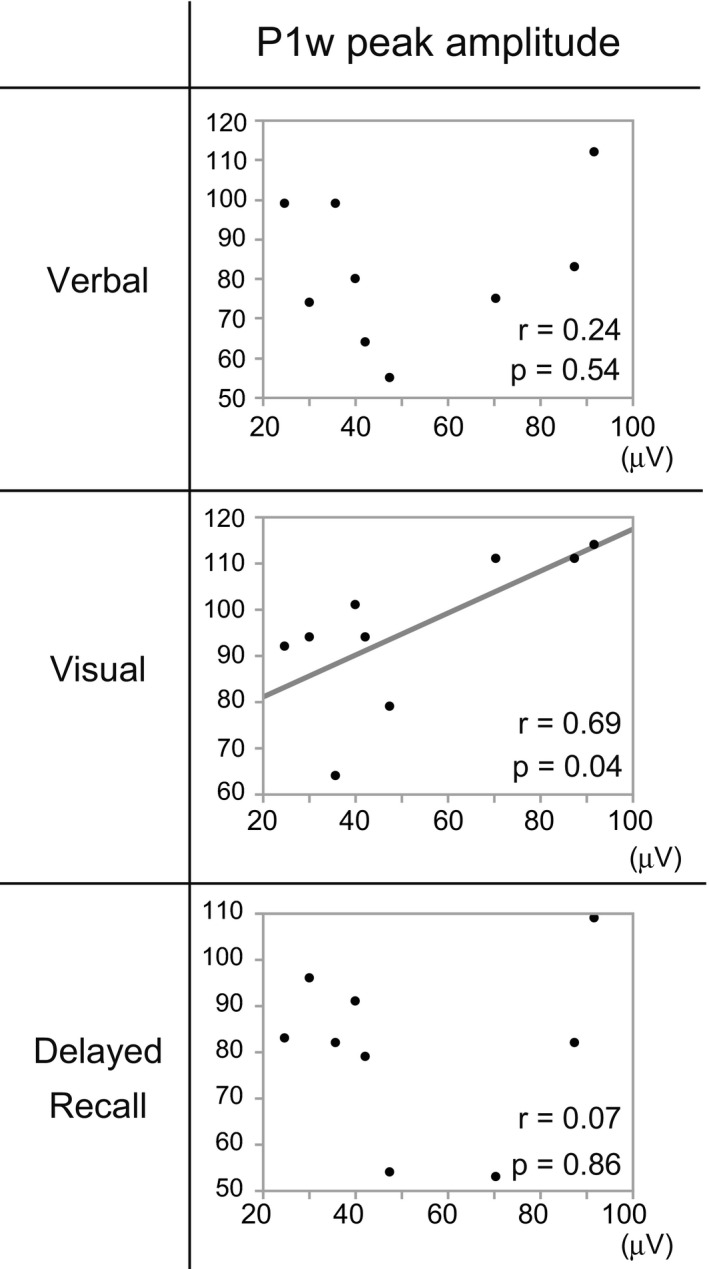
P1w peak amplitude and WMS‐R MQ scores. Linear regression analysis between P1w peak amplitude and WMS‐R. The horizontal axis denotes the value of P1w peak amplitude and the vertical axis MQ scores. Moderate‐to‐high significant correlations are observed between P1w peak amplitude and visual MQ of WMS‐R (r = .69)