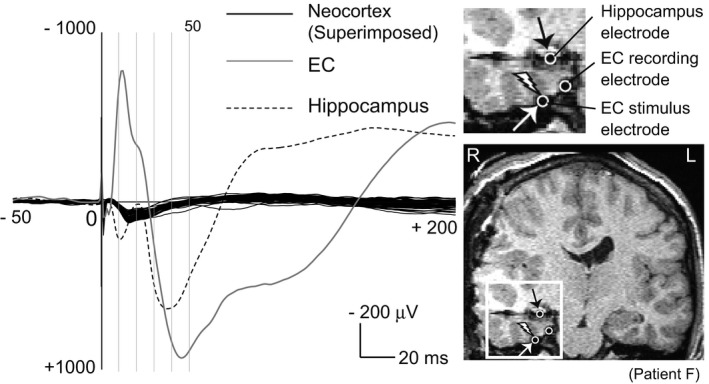
Figure 6.

Large evoked potentials in the EC and hippocampus electrode near the stimulus site. The right lower figure shows coronal section of an MRI taken after electrode implantation in patient F. The area enclosed by the white square is enlarged in the right upper figure. Electrodes are hypointense signals due to the property of the platinum alloy. The left figure shows the evoked potentials by the EC stimulation. White open circle with a thunder symbol indicates location of stimulus electrode for EC stimulation. For EC stimulation, only one pair of stimulating electrodes is visible in the coronal section. The black solid lines are the superimposed cortico‐cortical evoked potential (CCEP) waveforms. Only CCEP waveforms recorded from the lateral brain surface are superimposed. The gray solid line and black dotted line are the evoked response recorded in the EC recording electrode (white open circle) and the hippocampus electrode (white open circle with black arrow), respectively
