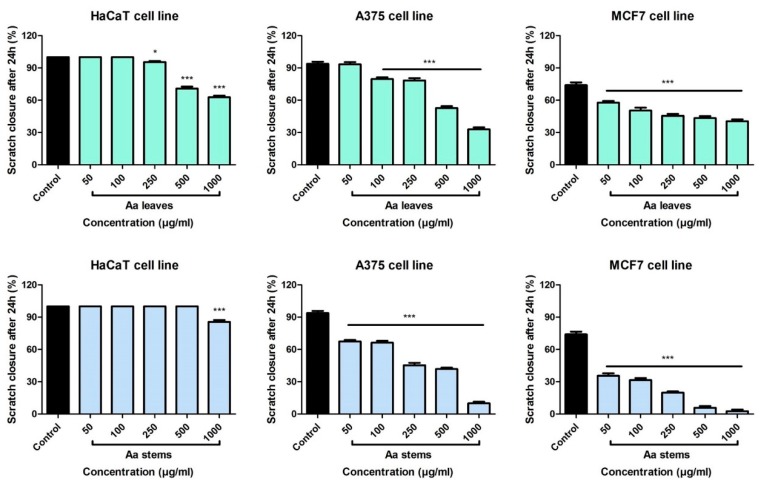
Figure 4.
The migratory potential of HaCat, A375 and MCF7 cells following treatment with A. absinthium leaves and stems ethanolic extract (50, 100, 250, 500 and 1000 µg/mL). Images were taken by light microscopy at 10× magnification (the scale bars represent 100 μm). The bar graphs are expressed as percentage of scratch closure after 24 h compared to the initial surface. Comparison among the groups was performed using the One-way ANOVA test followed by Dunnett’s post-test. (* p < 0.05; *** p < 0.001 vs. Control-cells stimulated with ultrapure water).

