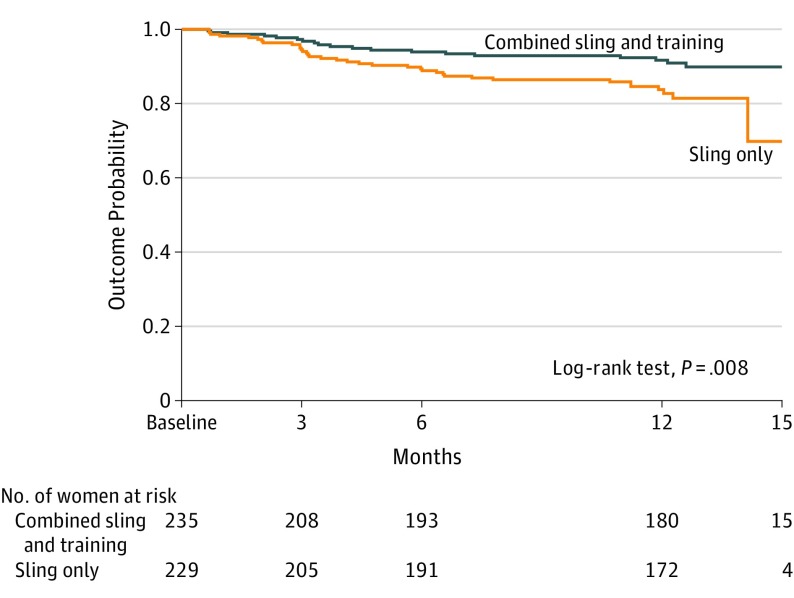
Figure 3. Kaplan-Meier Probability Curve for Additional Treatment Between Groups.
The probability-of-outcome curve shows length of time after initiation of the intervention until occurrence of receiving additional treatment for any urinary symptom. There was a significant difference in survival times between the treatment groups. The median time to treatment for retreated individuals was 122 days (interquartile range [IQR], 87-210) for the combined treatment group (sling and behavioral and pelvic muscle training) and 113 days (IQR, 72-223) for the sling-only group.

