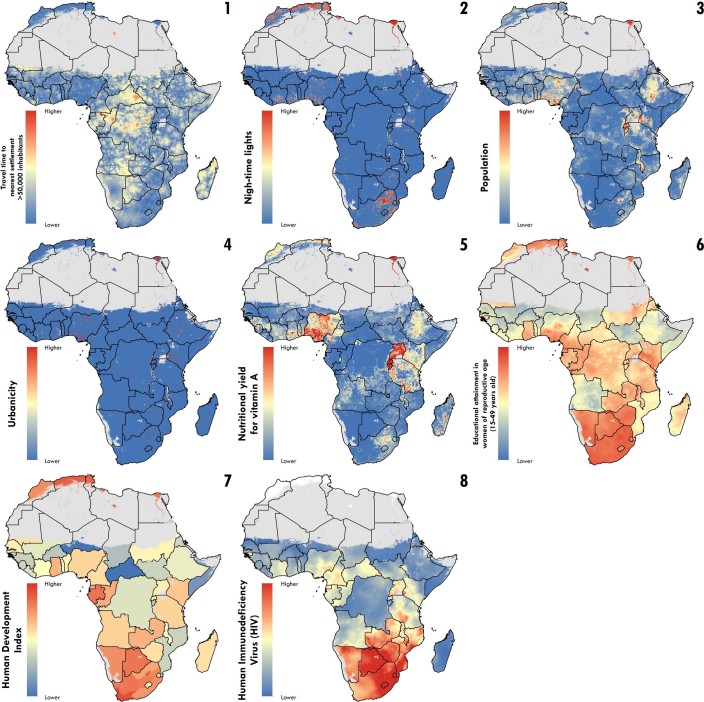
Extended Data Fig. 5. Map of covariates.
Covariate raster layers of possible socioeconomic, environmental and health-related covariates used as inputs for the stacking modeling process. Time-varying covariates are presented for the year 2017. For additional detail on the year of production of non-time-varying covariates, see the individual covariate citation in Supplementary Table 7. Maps reflect administrative boundaries, land cover, lakes and population; gray-colored grid cells had fewer than ten people per 1 km × 1 km grid cell and were classified as ‘barren or sparsely vegetated’, or were not included in this analysis.

