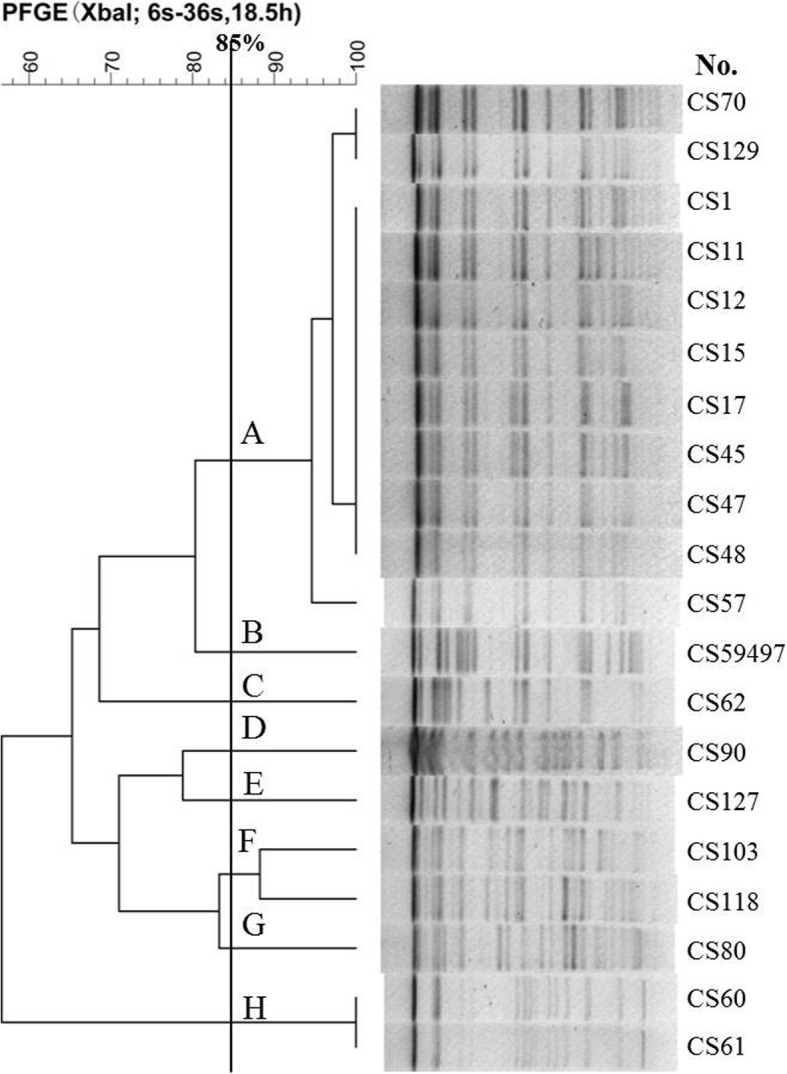
Fig. 3.

Relationships of the 20 CR-hvKP isolates based on Pulsed Field Gel Electrophoresis (PFGE). The 20 CR-hvKP isolates were analyzed by PFGE using XbaI. The interpretation of the PFGE patterns was performed with BioNumerics software using the Dice similarity coefficient. The tree indicates relative genetic similarity and was constructed on the basis of the unweighted pair group method of averages (UPGMA). A PFGE pattern with more than 85% DNA bands that are different from the others is taken to be a unique PFGE pattern
