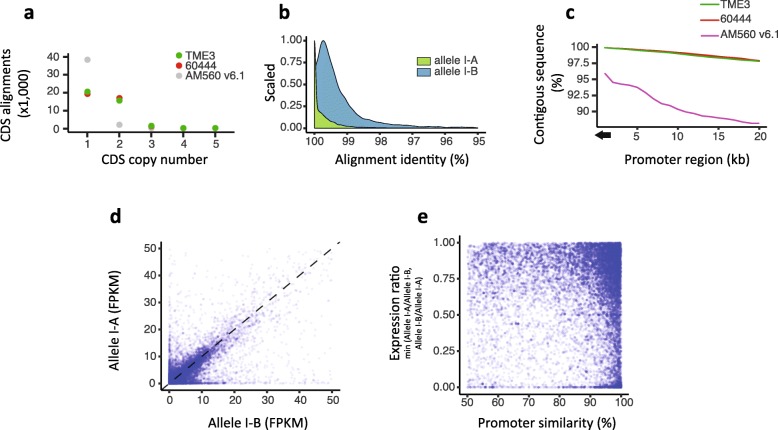
Fig. 2.
Haplotype phasing, allele nucleotide diversity, and allele-specific expression analysis for haplotype-aware cassava genomes. a Cassava CDS collection (n = 41,381) and their alignment copy number distribution in the two African cassava genomes TME3 (green points) and 60444 (red points), and the AM560 v6.1 genome (gray points). b Sequence alignment properties for the bi-allelic reference CDSs (n = 13,425) found in the 60444 genome. Bi-allelic genes, depicted as allele I-A and allele I-B, are presented as a green curve, and the homologous allelic counterpart as a blue curve. Percentage of alignment identity is shown on x-axis and data point density on the y-axis. c Promoter sequence contiguity (“N”-free-sequence) comparison between three different cassava genomes measured using 1-kb bins over a 20-kb region upstream the transcriptional start site. d Scatterplot of allele-specific gene expression in 60444 based on RNA read counts measured as fragments per kilobase of sequence per million mapped reads (FPKM). A bi-allelic gene is depicted as a single blue dot. Expression of one allelic copy is shown on the x-axis and the expression of the homologous counterpart on the y-axis. e Bi-allelic gene expression as a function of promoter sequence similarity. The bi-allelic gene expression ratio (y-axis) of 1.00 indicates an equal expression of both alleles, whereas the expression ratio of < 0.25 indicates mono-allelic expression (n = 3451). The promoter sequence similarity between the homologous alleles measured for a 2-kb region upstream of the start codon is shown on the x-axis. Bi-allelic genes with identical or near-identical promoter sequences can have mono-allelic expression

