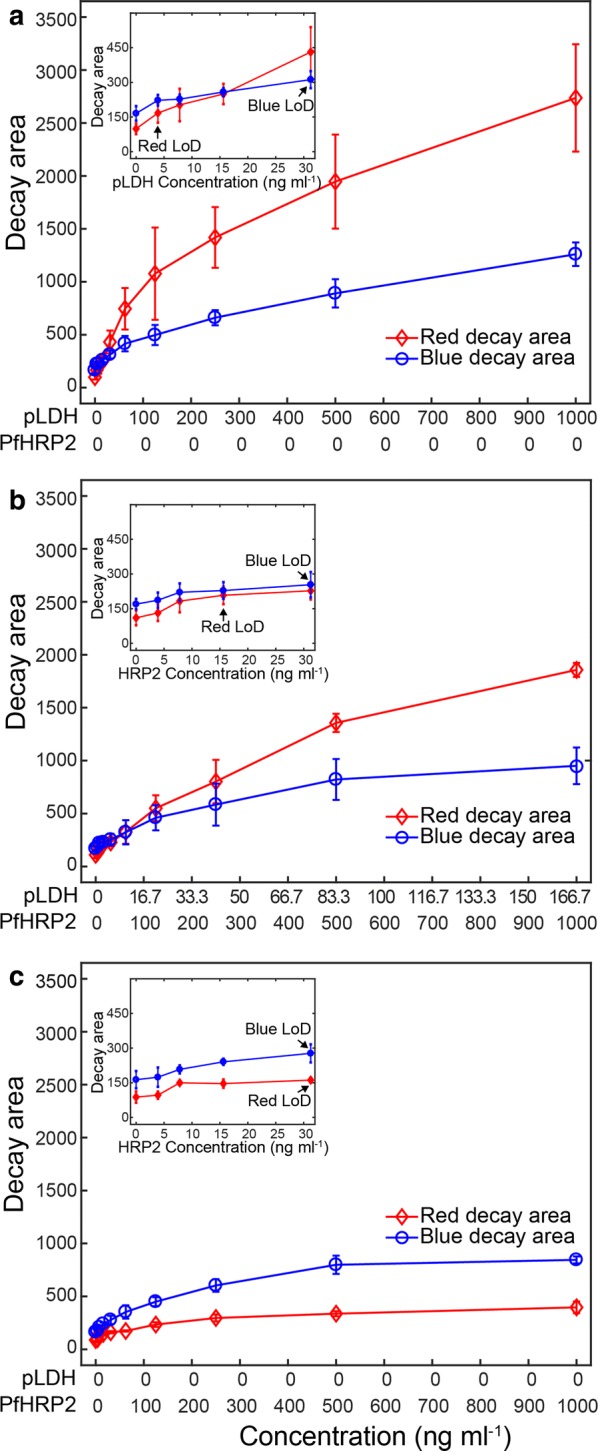
Fig. 4.

Calculation of red and blue decay areas at the test lines. The red and blue decay areas were calculated from Fig. 3 for a pLDH detection only, b simultaneous pLDH and PfHRP2 detection, and c PfHRP2 detection only. The different degrees of decay areas between the red and blue intensities were observed as a function of sample types and concentrations. The inserted graphs were zoomed in at lower concentrations. The LoD to distinguish from non-target samples was 31.2 ng mL−1 for all detection modes. Error bars indicate standard deviations from triplicate experiments
