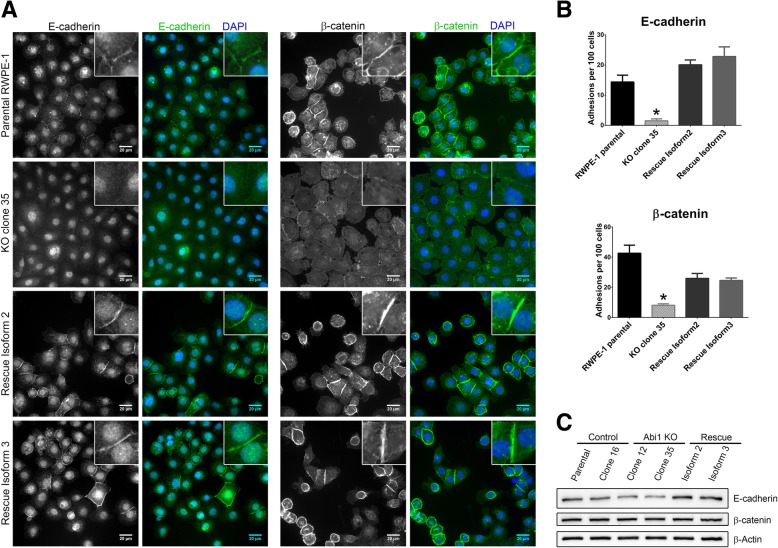
Fig. 3.
Loss of membrane localization of adherens junction proteins in ABI1 KO cells. (a) Immunostaining images showing localization of the adherens junction proteins (left) E-cadherin and (right) β-catenin. (b) Quantification of the number of cells with positive junctional staining per 100 cells is shown. Quantification was performed in 6 independent fields per cell line. The graph was generated with Prism software, and the results are represented as the mean ± SEM, unpaired Student’s t-test (p < 0.05). (c) Western blot analysis of the same proteins showed a modest decrease or no change upon loss of Abi1

