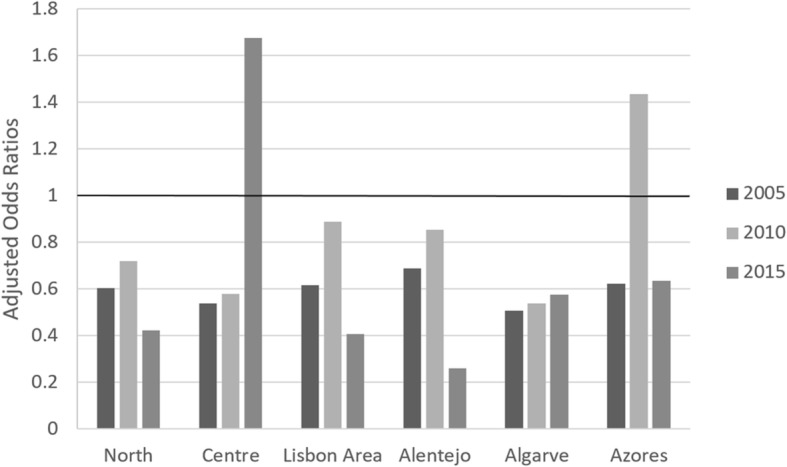
Fig. 4.

Risk of catastrophic expenditure across regions NUT II – Adjusted Odds Ratios: 2005/06; 2010/11 and 2015/16. Notes: Odds Ratios are adjusted for household annual monetary income, household dimension, level of education of head of household, the presence of at least one elder member in household, rural vs urban area. The reference category for Regions is Madeira. The line AOR = 1 corresponds to equal risk of CHE, compared to Madeira. All coefficients are statistically significant at 1% in 2005 and 2010; in 2015, only the coefficients for North (p < 0.1), Lisbon Area (p < 0.1) and Alentejo (p < 0.05) are statistically significant
