
Fig. 2.
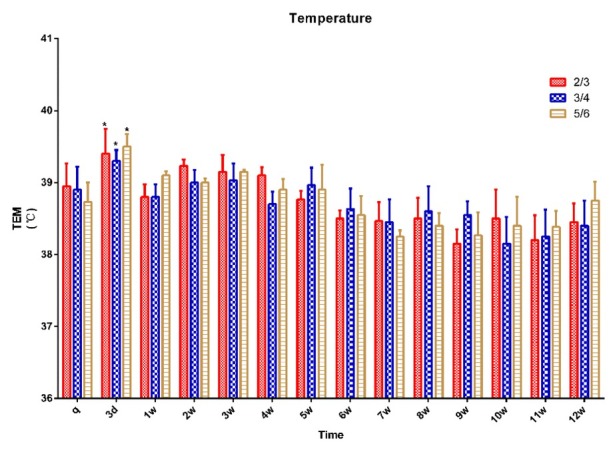
Rectal temperature in 15 pigs (n = 5 for ⅔ group, n = 5 for ¾ group, n = 5 for ⅚ group) q – preoperative baseline
* p < 0.05 compared with the preoperative baseline. A p < 0.05 compared with value of ⅔ group at the same time point. B p < 0.05 compared with value of ¾ group at the same time point