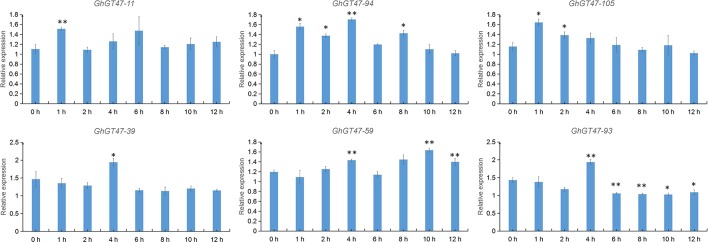
Figure 10.
Expression analysis of GhGT47s under cold treatment via qRT-PCR. The 1 h, 2 h, 4 h, 6 h, 8 h, 10 h and 12 h indicate h after cold treatment, with 0 h representing the control sample. Single and double asterisks represent significant differences from the control sample at the 0.05 and 0.01 levels, respectively. Error bars show the standard deviation of three biological replicates.

