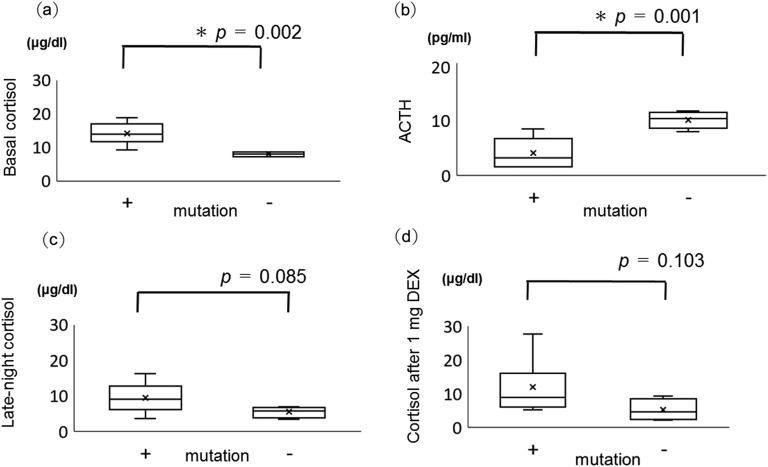
Figure 2.
(a) Basal cortisol level, (b) plasma ACTH level, (c) late-night cortisol level, and (d) cortisol level after 1 mg DEX in ARMC5 pathogenic or likely pathogenic variant–positive patients (+) and negative patients (−). Box plots show median (interior line), minimum and maximum (whiskers), and average (x). *P < 0.05.

