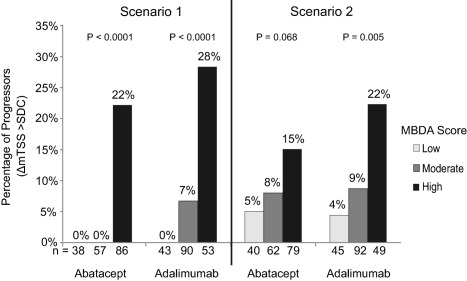
Figure 1.

Sensitivity analysis examining the association between radiographic progression and multi‐biomarker disease activity (MBDA) score in the AMPLE study (Abatacept versus Adalimumab Comparison in Biologic‐Naive Rheumatoid Arthritis Subjects with Background Methotrexate). Percentages of patients with radiographic progression at year 1 were analyzed by year 1 MBDA category for the abatacept arm and adalimumab arm, using published data from Fleischmann et al 1. Progressors were defined as having changes in the modified total Sharp score (ΔmTSS) exceeding the smallest detectable change (SDC) 1. The number of progressors in an individual MBDA category (low, moderate, or high) was determined in 2 steps. First, the total number of progressors in the 3 MBDA categories was calculated by subtracting the total number of nonprogressors, summed from Figure 2D in the report by Fleischmann and colleagues, from the total number of patients, obtained from Supplementary Table 5 in their report 1. Next, the total number of progressors was distributed across the 3 MBDA categories in 2 scenarios, representing the most extreme possibilities compatible with the reported data: Scenario 1 (least conservative) assigned all progressors to the highest possible MBDA categories; Scenario 2 (most conservative) assigned all progressors to the lowest possible MBDA categories (for numerical details, see Supplementary Tables 1 and 2, on the Arthritis & Rheumatology web site at http://onlinelibrary.wiley.com/doi/10.1002/art.39981/abstract). N values on the x‐axis are the number of patients in the MBDA category, i.e., the sum of progressors (P) and nonprogressors (NP) in that MBDA category. The percentage of patients with radiographic progression in each MBDA category is 100 × (P/[P + NP]). Statistical significance was determined by Mantel‐Haenszel test for trend, assuming ordinality in the MBDA categories.
