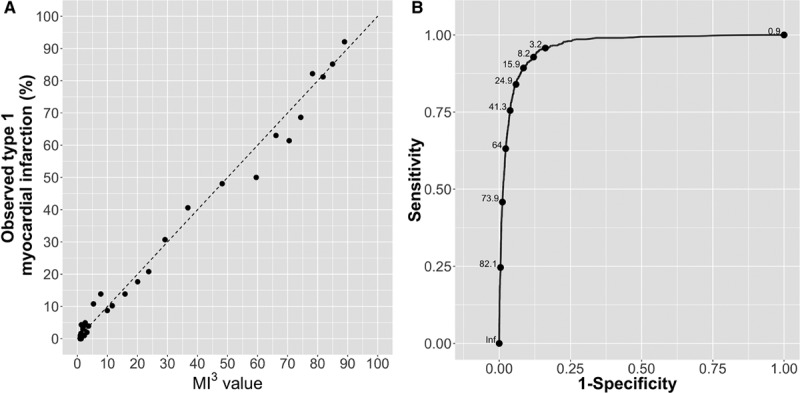
Figure 1.

Calibration and discrimination of the myocardial-ischemic-injury-index (MI3) algorithm. Calibration of the MI3 algorithm with the observed proportion of patients with type 1 myocardial infarction in the test data set (A). Each point represents 100 patients. The dashed lines represent perfect calibration. Receiver operating characteristic curve showing discrimination of the MI3 algorithm in the test data set (B). Some MI3 values shown for illustrative purposes only.
