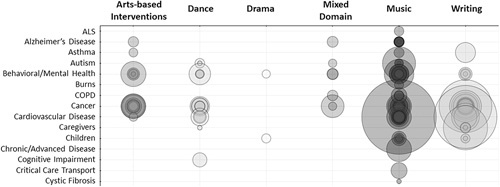
FIGURE 2.

The figure is a screenshot capture of the outcome matrix available as part of the interactive, online evidence map. The y-axis represents the populations and x-axis represents the types of arts-based interventions, coded with support of our community research partners and stakeholders from information provided by study authors. Each bubble represents an individual study identified in the literature, the size of the bubble indicates the total number of participants in each study. Bubbles are semitransparent and darker colors indicate multiple studies testing the same intervention/population combination. ALS indicates amyotrophic lateral sclerosis; COPD, chronic obstructive pulmonary disease.
