
FIGURE 2.
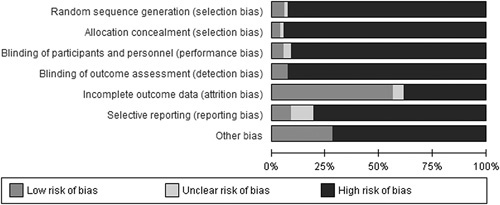
Risk of bias graph: Review authors’ judgments about each risk-of-bias item presented as percentages across the 56 studies.
Official websites use .gov
A
.gov website belongs to an official
government organization in the United States.
Secure .gov websites use HTTPS
A lock (
) or https:// means you've safely
connected to the .gov website. Share sensitive
information only on official, secure websites.
Risk of bias graph: Review authors’ judgments about each risk-of-bias item presented as percentages across the 56 studies.