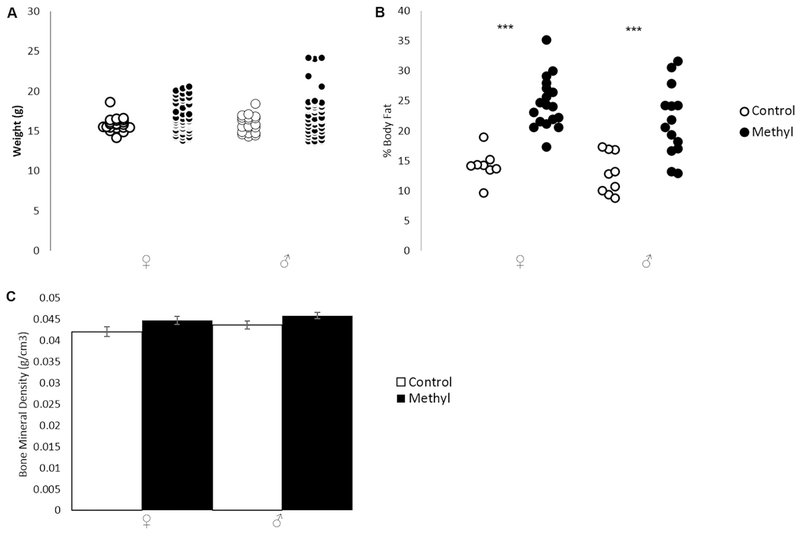
Figure 2.
Weight and DEXA Scan data for PO animals on control- or methyl-diets. Open shapes are control animals while filled-in shapes are methyl-diet animals. Female is indicated by “♀,” and male is indicated by “♂.” A) Distribution of weights in grams (p=0.072 for females; p=0.060 for males; two-tailed t-test). B) Distribution of percent body fat (p=0.0000013 for females; p=0.00061 for males; two-tailed t-test. C) Average bone mineral density in g/cm3for each experimental group (p=0.25 for females; p=0.07 for males; two-tailed t-test). Error bars indicate +/−1 standard error (*p<0.05; **p<0.01; ***p<0.001; two-tailed t-test). Weight was not significantly changed in either sex. Percent body fat was significantly higher in methyl-diet females compared to control females and in methyl-diet males compared to control males. Bone mineral density was unchanged in either sex.

