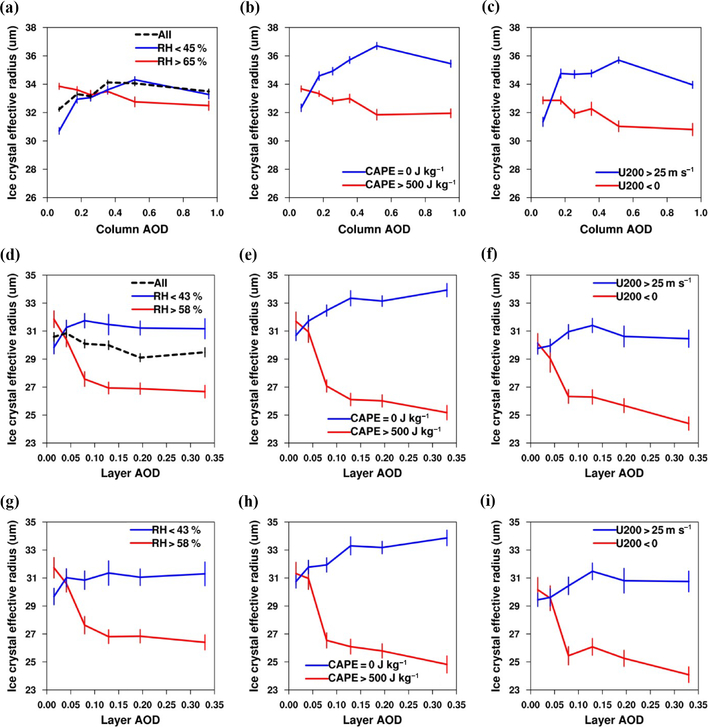
Figure 3.
Changes in Rei of convection-generated and in situ ice clouds with aerosols. (a-c) Changes in Rei of convection-generated ice clouds with AOD for different ranges of (a) RH100–440 hPa, (b) CAPE, and (c) U200. (d-f) Changes in Rei of in situ ice clouds with layer AOD for different ranges of (d) RH100–440hPa, (e) CAPE, and (f) U200. (g-i) The same as (d-f) but for the profiles with dust aerosols only. The meteorological parameters are divided into three ranges containing similar numbers of data points, and the curves for the medium range are not shown. Note that we use column AOD and layer AOD mixed with ice clouds as proxies for aerosols interacting with convection-generated and in situ ice clouds, respectively. The definition of error bars is the same as in Fig. 1. The total numbers of samples used for convection-generated and in situ ice clouds are 2.73 × 10⁴ and 1.09 × 10⁴, respectively.

