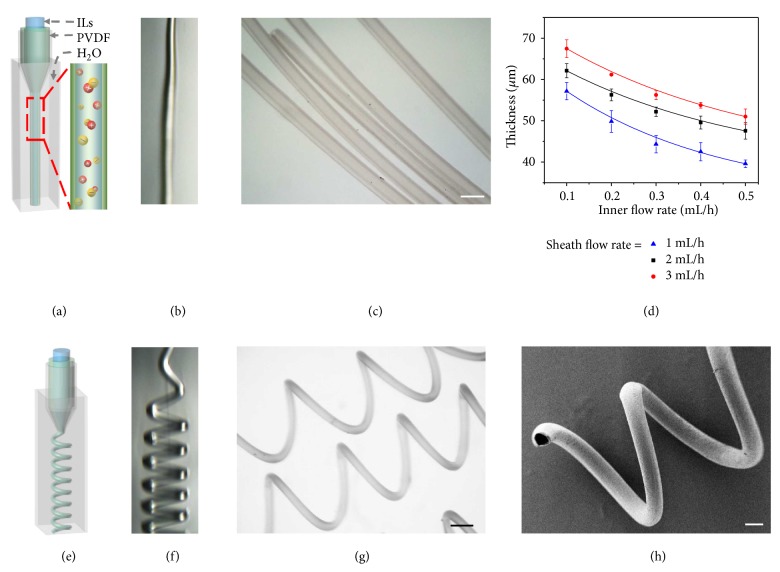
Figure 2.
Microfluidic generation of microfibers. (a-b) Schematic illustration and real-time microscopy image of microfluidic spinning of straight microfiber with ionic liquid encapsulation, respectively. (c) Optical microscopy image of core-shell structured microfiber. (d) Relationship between thickness of straight microfiber and flow rates. (e-f) Schematic illustration and real-time microscopy image of microfluidic spinning of microspring with ionic liquid encapsulation, respectively. (g) Optical microscopy image of core-shell structured microspring. (h) SEM image of the core-shell structured microspring. Scale bars are 200 μm in (c) and (h), 250 μm in (g), respectively.

