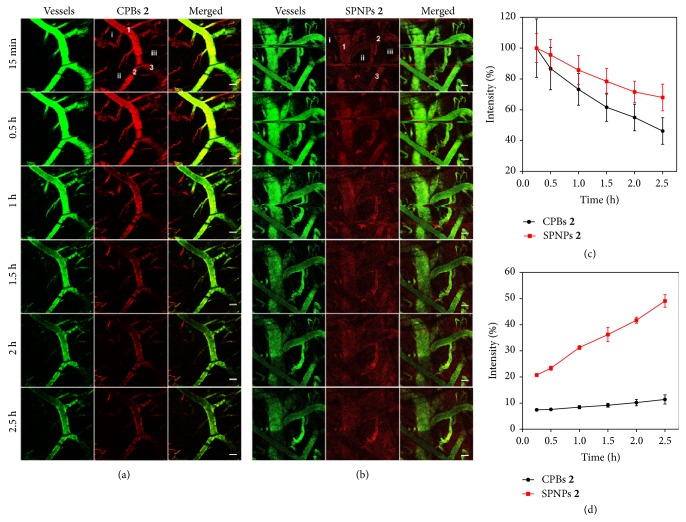
Figure 5.
Real-time observation of in vivo extravasation of CPBs 2 and SPNPs 2 from tumor vessels. Intravital CLSM images of a local tumor area at different time points after tail-vein injection of the RBITC-labeled CPBs 2 ((a) red) or SPNPs 2 ((b) red). The blood vessels were stained by FITC-labeled dextran (green). Scale bar = 100 μm. Evolution with time of mean fluorescence intensities of three intravascular areas (c) marked as 1, 2, and 3 in (a) or (b) and three extravascular areas (d) marked as i, ii, and iii in (a) or (b). The mean fluorescence intensities were normalized to the respective intravascular intensities of CPBs 2 or SPNPs 2 at 15 min p.i. 3 mice were used for either CPBs 2 or SPNPs 2 in the intravital CLSM imaging.

