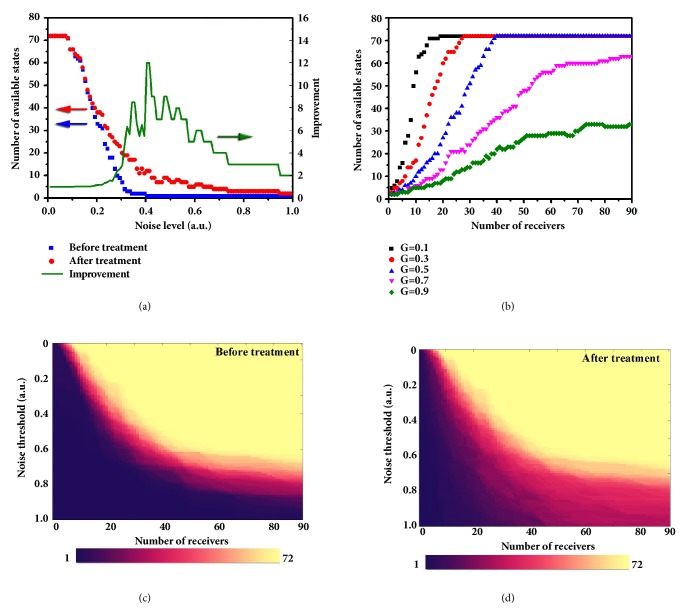
Figure 3.
Quantitative analyses of the channel optimization algorithm under different noise levels and numbers of receivers for a 9-column DDM system. (a) The variation of numbers of the available digital states before and after the optimization treatment as the noise level increases from 0 to 1. The green line represents the improvement (ratio) of the numbers of available digital states before and after the optimization treatment. (b) The variation of numbers of the available digital states under different noise levels as the number of receivers increases from 1 to 90. Note that the number is counted from 1° with step of 1°. (c, d) The dependences of numbers of the available digital states on the number of receivers and the noise threshold, respectively.

