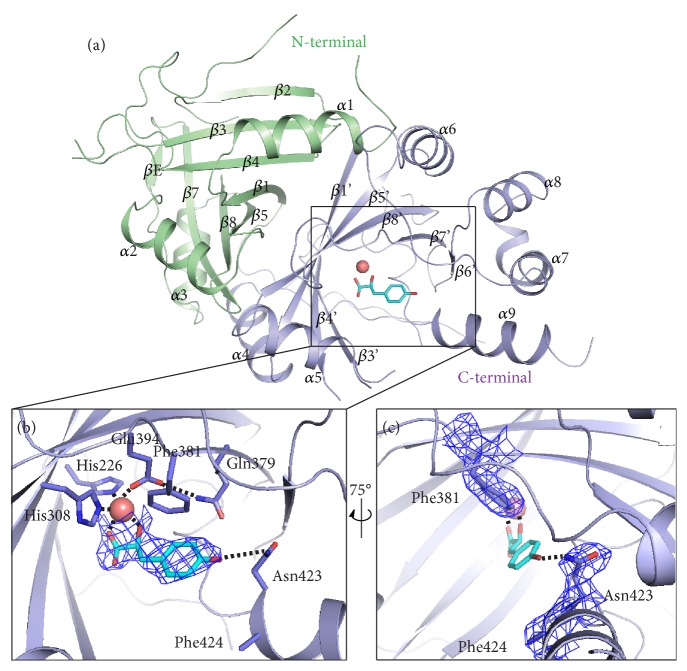
Figure 1.
Crystal structure analysis of AtHPPD-HPPA complex. (a) Overall structure of AtHPPD-HPPA complex. The C- and N-terminal β-barrel domains are colored in light blue and green, respectively. The metal atom is shown as a deep salmon sphere, and HPPA was displayed in cyan. (b) An expanded view of the AtHPPD active site showing an H-bond interaction between the HPPA and the residues nearby. (c) The expanded view of the AtHPPD active site related to B with a 75° rotation around a vertical axis. Light blue electron densities (2Fo–Fc map) correspond to HPPA and key residues contoured at 1.0 σ. The key residues are shown in sticks, while the chelation with the metal ion and the H-bonds are indicated with black dash lines.

