Figure 5.
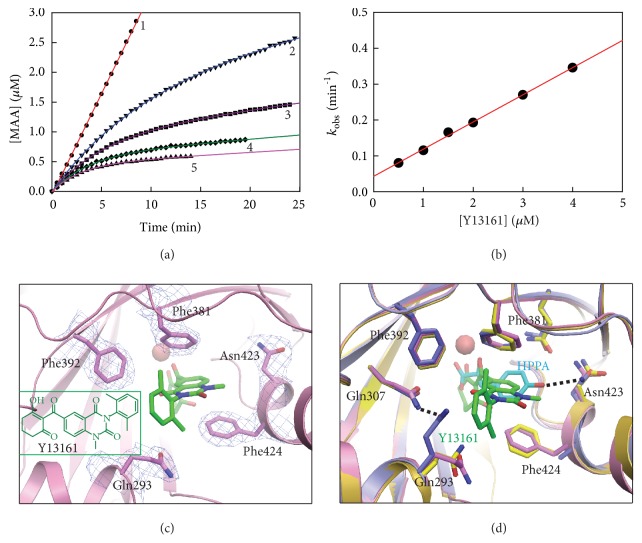
Inhibitory kinetics of AtHPPD by compound Y13161 and structural analysis of AtHPPD-Y13161 complex. (a) Progress curves in the presence of varying concentrations of Y13161 on the inhibition of AtHPPD. The assays were carried out in the presence of 80 μM HPPA and various concentrations of compound Y13161 (1, 0 μM; 2, 1.0 μM; 3, 2.0 μM; 4, 3.0 μM; and 5, 4.0 μM). (b) Secondary plot of kobs against concentrations of compound Y13161. Experimental data are shown as solid black dots and fitting lines as colored solid lines. (c) The close-up view of the active site illustrating the binding mode of Y13161 (shown in green stick). Light blue electron densities (2Fo–Fc map) correspond to the key residues contoured at 1.0 σ. (d) The superposition of the active sites of AtHPPD-Y13161 complex (pink) with holo-AtHPPD (yellow) and AtHPPD-HPPA complex (light blue, HPPA showed as cyan stick). The key residues are shown as sticks and H-bond interactions are shown as dash lines.

