Figure 5.
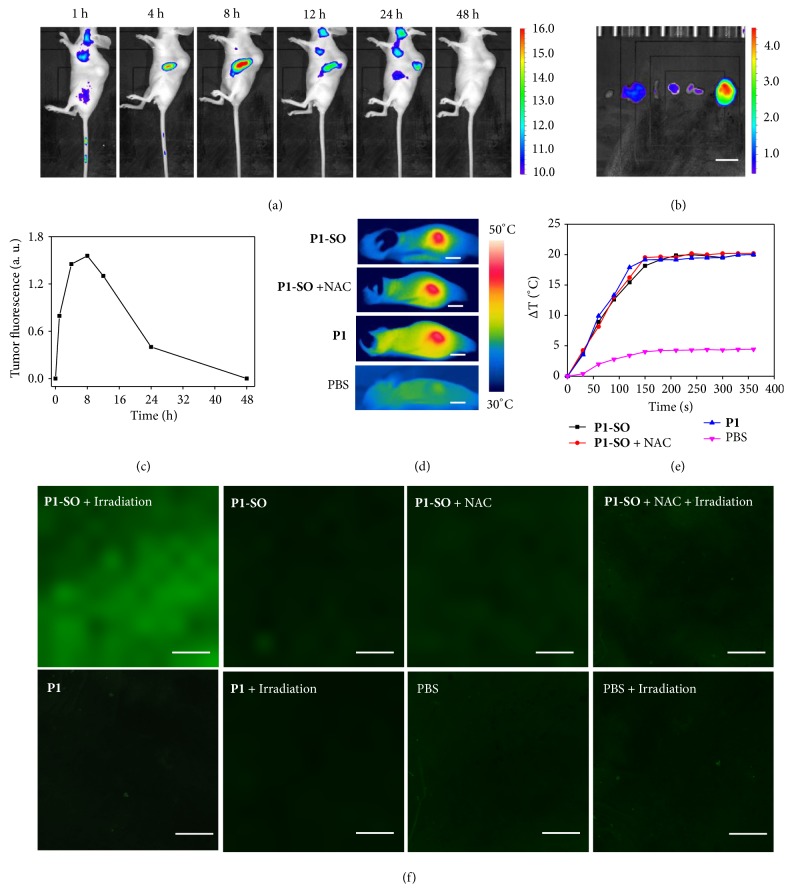
In vivo photothermal effects and generation of 1 O 2 of P1 and P1-SO. (a) In vivo fluorescence imaging of the HeLa tumor-bearing mouse at different time points after tail intravenous injection of P1-SO. (b) Fluorescence imaging of main organs after tail intravenous injection of P1-SO 8 h (scale bar, 1 cm). (c) The fluorescence intensity of tumor at different time. (d) Photothermal imaging of the mice bearing HeLa tumor treated with different treatments under irradiation (690 nm, 400 mW/cm2) (scale bar, 1 cm). (e) Temperature changes of mice tumors with different treatments under irradiation for 6 min (690 nm, 400 mW/cm2). (f) DCFH-DA staining at the tumors of mice with different treatments under irradiation for 6 min (690 nm, 400 mW/cm2) (scale bar, 250 μm).

