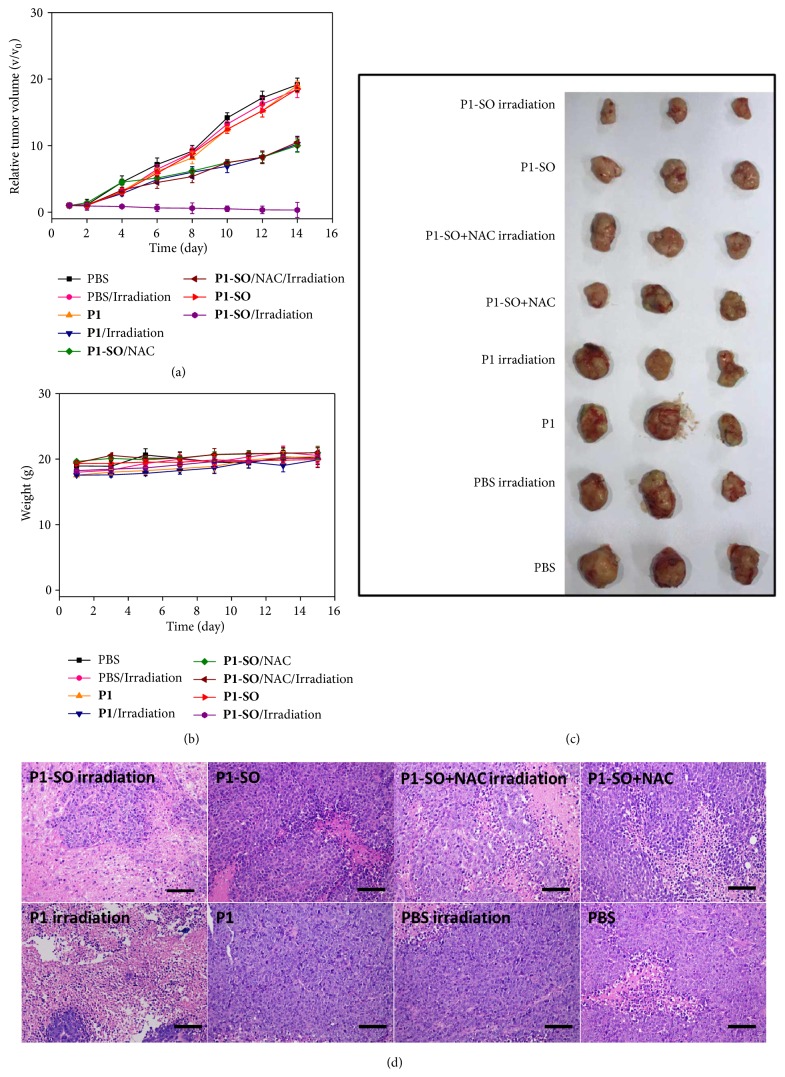
Figure 6.
In vivo treatments of P1 and P1-SO. (a) Relative tumor volume changes of mice with different treatments. Relative tumor volume was calculated by the (b) Body weight changes of mice with different treatments. (c) Photograph of the tumors extracted from the mice. (d) H&E-stained tumor sections harvested from mice after different treatments (scale bar, 100 μm).

