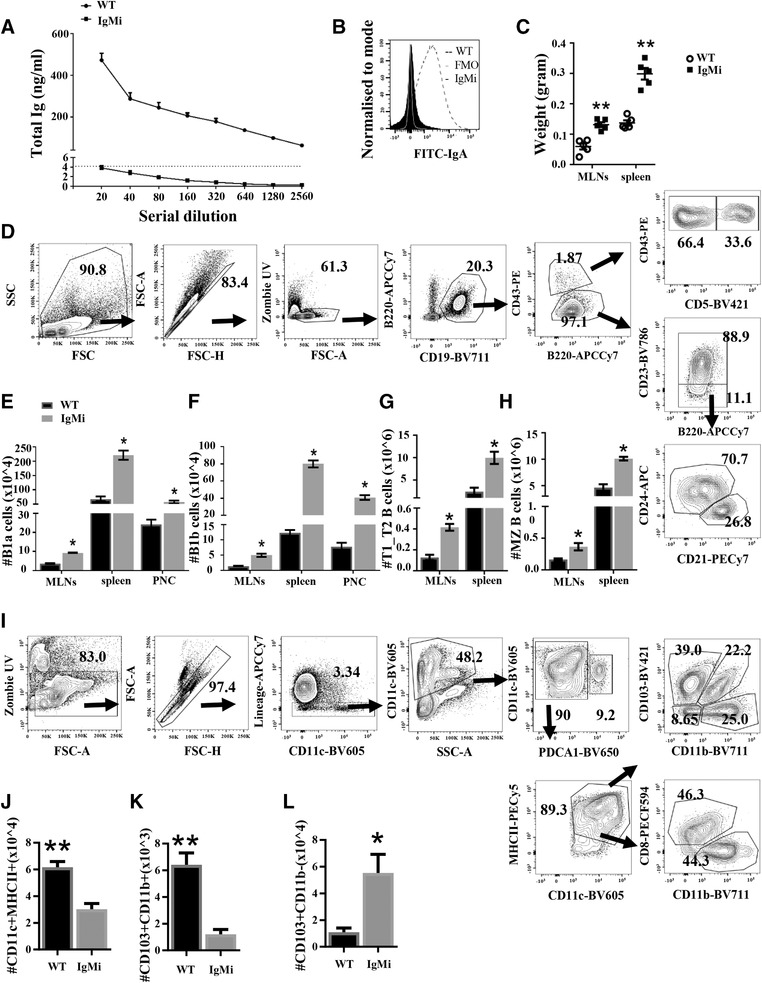
Figure 1.

The absence of secreted antibodies in the IgMi mouse affects B cell and dendritic cell subsets. WT and IgMi mice were analyzed for (A) serial dilution of total Ig (ng/mL) using ELISA. Total Ig levels were quantified in serum samples of WT and IgMi mice relative to an IgA standard. (B) Faecal samples were stained with IgA using flow cytometry. (C) The comparison of weight of MLNs and spleen between IgMi mice and their age‐matched WT littermates. (D) Gating strategy to analyze B‐cell subsets in the spleen. B1a was defined as CD19+B220low/midCD43+CD5+, B1b as CD19+B220low/midCD43+CD5‐, marginal zone (MZ) as CD19+B220+CD5‐CD43‐CD23‐CD24‐CD21+ and transitional B cells as CD19+B220+CD5‐CD43‐CD23‐CD24+CD21−. (E–H) B‐cell subsets in IgMi mice were altered either in secondary lymphoid organs or peritoneal cavity (PNC). (I) Gating strategy for DC subsets. Two main DCs populations: conventional DCs (cDCs) and plasmacytoid DCs (pDCs). Conventional DCs was divided into migratory DCs and resident DCs. Migratory DCs consisted of four subpopulations: CD103+CD11b−, CD103+CD11b+, CD103‐CD11b+, and CD103‐CD11b−. Resident DCs was consisted of two subpopulations: CD8a+CD11b− and CD8a‐CD11b+. Plasmacytoid DCs: CD11c+lineage‐PDCA‐1+. (J) Total cell number of CD11c+MHCII+ in MLNs. (K) Total cell number of CD103+CD11b+ in MLNs. (L) Total cell number of CD103+CD11b− in the spleen. Sensitivity of the assay is shown as mean ± SD (dotted black line). (A&B) Data are representative of two separate experiments, n = 4/group, males, 12 weeks old. (C–L) Data are pooled from two separate experiments. All data are expressed as mean ± SEM. *p < 0.05, **p < 0.01 Mann–Whitney test.
