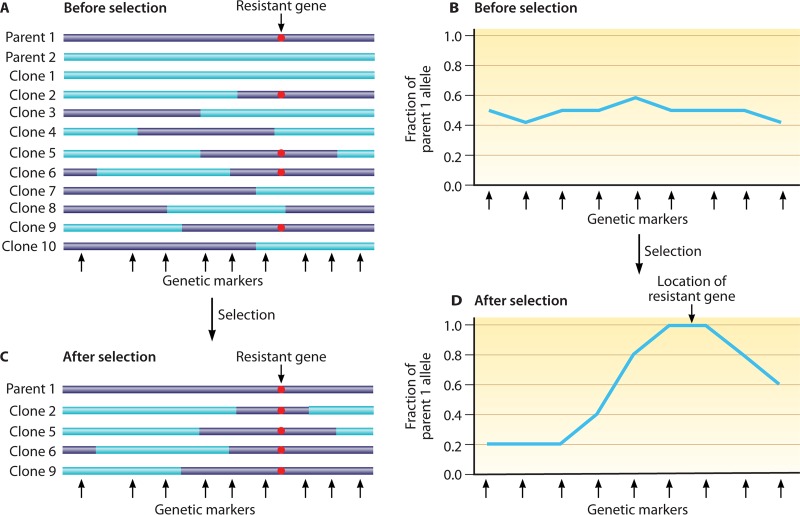
FIG 2.
Diagram illustrating the principle of genetic recombination and linkage group selection. (A) Genetic recombination between parental lines (purple and blue) results in progenies harboring various combinations of the parental chromosomal segments. The bars represent chromosomal segments with a putative resistance marker from parent 1 (red dot) distributed among the progenies. Black arrows at the bottom denote positions of polymorphic genetic markers between the two parents. (B) Ratios of resistant alleles from parent 1, showing approximately 50% of allele ratios of the parents before selection. (C) After selection, only the parasites carrying the resistant allele (red dot) survive. (D) A plot of the ratios of resistant alleles shows increased frequency (to 100%) at one locus of the chromosome segment, suggesting at least one genetic determinant contributing to parasite survival or resistance to selection pressure in the locus. Fine-mapping with additional recombinant progenies and genetic markers may identify the gene(s) conferring the resistance.

