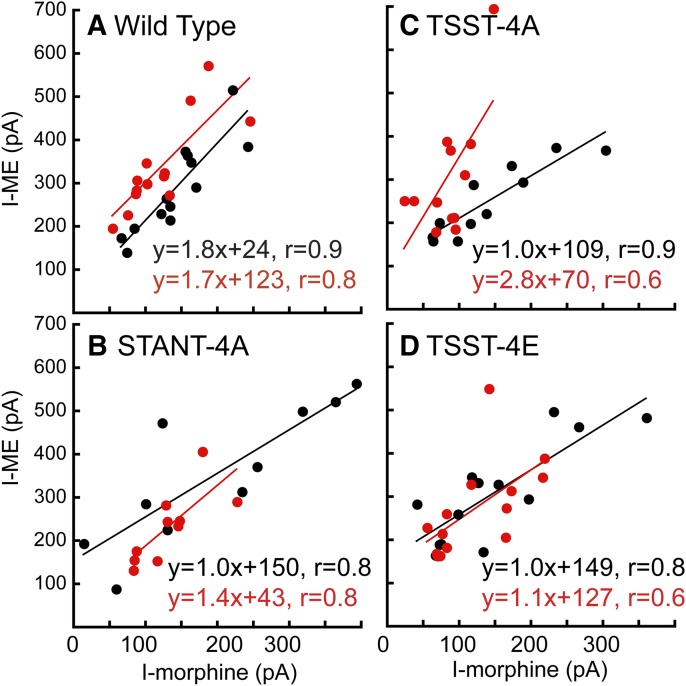
Fig. 3.
Summary of results comparing the current induced by morphine (1 µM) plotted against the current induced by ME (30 µM) in individual cells in slices from untreated (black) and morphine-treated (red) animals. (A) Cells in slices taken from wild-type animals. The current induced by morphine after treatment with morphine is smaller than that in untreated animals. (B) Cells taken from animals after expression of the STANT mutant. (C) Cells taken from animals after expression of the TSST-4A mutant. (D) Cells in slices taken from animals expressing the TSST-4E mutant.

