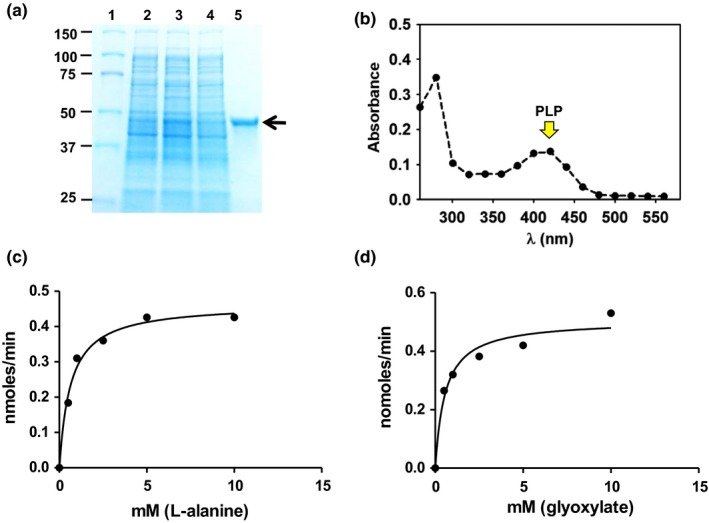
Figure 3.

Protein purification and biochemical characterization. (a) Purification of the At3g08860 protein to apparent homogeneity by affinity chromatography followed by SDS‐PAGE. Along with the molecular mass markers (kDa) (lane 1), the gel shows the profile of 10 μg of uninduced soluble proteins (lane 2), 10 μg of induced soluble proteins (lane 3) and 0.5 μg of the purified recombinant enzyme (black arrow) (lane 4). (b) A wavelength scan of the protein shows a peak around 420 nm (indicated by the yellow arrow), which is characteristic of PLP‐containing proteins
