
Figure I. Functional brain network analysis pipeline.
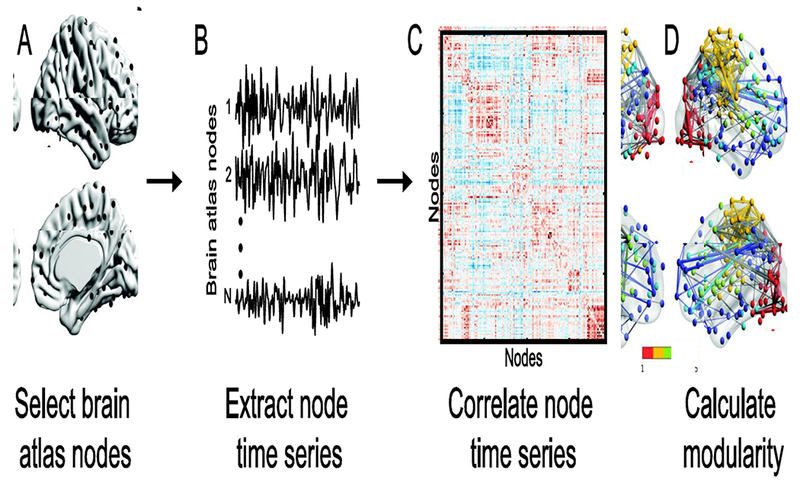
(A) The brain is first parcellated into a set of brain regions to form network nodes (e.g., the Power et al. atlas [37]). (B) For functional network analyses, the time series of each node is then extracted. (C) The time series of every possible pair of brain regions is then correlated to form the network edges. (D) The network is then partitioned into sub-networks or modules. Finally, the modularity of the network can be calculated by comparing within and between module connections. Brain network images in (A) and (D) were visualized with the BrainNet Viewer [85].