
Extended Data Figure 6. Cholesteryl hemisuccinate, map features at Thr276 and Ser277, and SERT-noribogaine complex.
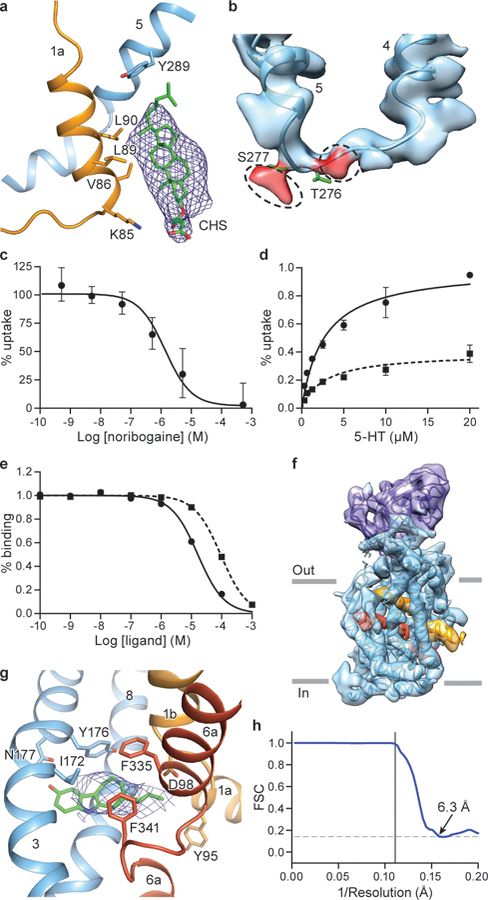
a, Interaction between CHS, TM1a and TM5 in the occluded conformation of the ΔN72,C13 SERT/15B8/ibogaine complex in 100 mM NaCl. b, Non-proteinaceous density features (red) near Thr276 and Ser277. c, Noribogaine inhibition of 5-HT transport for ΔN72,C13 SERT. 5-HT transport was measured using 20 μM [3H]5-HT in presence of the indicated concentrations of noribogaine. The mean IC50 of noribogaine inhibition of serotonin transport was determined from the curve with the error of the fit (s.e.m.): 1.2 ± 0.2 µM. Symbols show the mean derived from n=3 biological replicates. Error bars show the s.e.m. Experiment was performed twice independently with the same results. d, Michaelis–Menten plots of 5-HT uptake for the ΔN72,C13 transporter in the absence (circles), or in presence (dash, squares) of 1 µM noribogaine, the mean Km was determined from the curve with the error of the fit (s.e.m.): ΔN72,C13: 2.7 ± 0.6 µM; in presence of noribogiane: 2.7 ± 0.9 µM. Symbols show the mean derived from n=3 biological replicates. Error bars show the s.e.m. e, Noribogaine (circles) and ibogaine (dash, squares) competition binding with [3H]paroxetine for ΔN72,C13 SERT, Symbols show the mean derived from n=3 technical replicates. Error bars show the s.e.m. f, Density map of the ΔN72,C13 SERT/15B8/noribogaine complex, in 100 mM KCl, fit with the model derived from the inward-open ibogaine-bound SERT complex. SERT is cyan and the 15B8 Fab is purple; TM1 and TM6 of SERT are shown in orange and red, respectively. g, Noribogaine density in the central binding pocket. The fit of noribogaine into the EM density map was derived from ibogaine bound SERT in the inward-open conformation and shown in blue mesh, and residues involved in binding (Tyr176, Asp98, Phe341, Phe335, Asn177, Ile172 and Tyr95) are drawn as sticks. h, FSC curve for noribogaine bound SERT complex. The high-resolution limit cutoff for refinement was 9.0 Å.