
Extended Data Figure 8. Measurement of ibogaine and noribogaine inhibition of mutants, effect of thermostabilizing Tyr110Ala mutation, movements of structural elements associated with alternating access mechanism, and alignment of TM5.
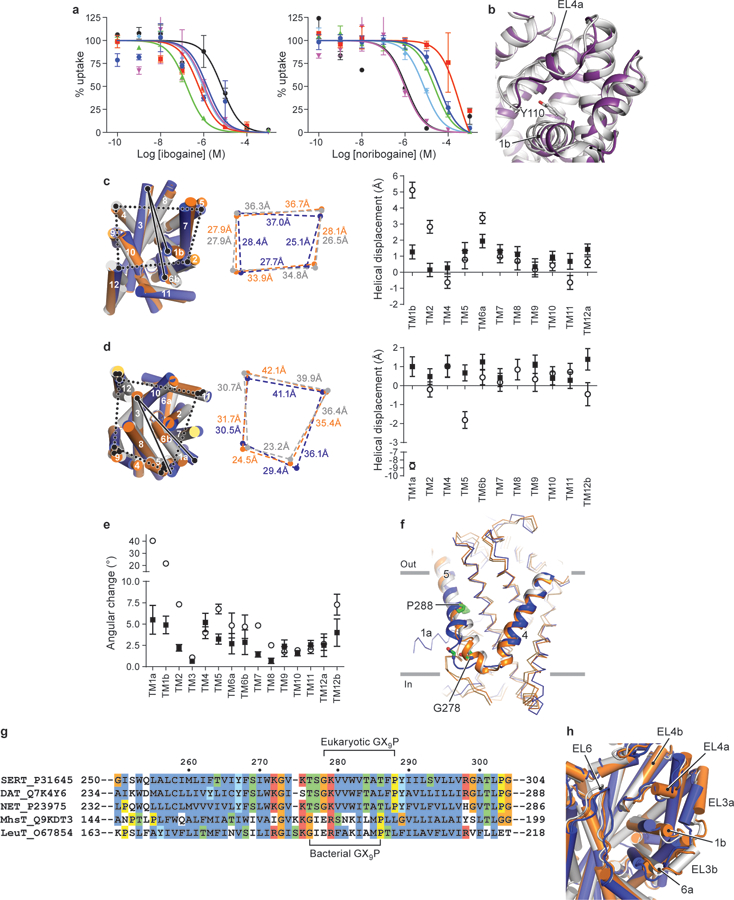
a, Inhibition of serotonin uptake by ibogaine or noribogaine for ts2. The mean IC50 of ibogaine and noribogaine inhibition of serotonin transport was determined from the curve with the error of the fit (s.e.m.) (black circles, ibogaine IC50, 7 ± 2 µM; noribogaine IC50, 1.1 ± 0.7 µM), Asn177Leu (blue circles, 1 ± 1 µM; 40 ± 10 µM), Asn177Val (green triangles, 0.17 ± 0.04 µM; 24 ± 5 µM), Asn177Ala (red squares, 0.6 ± 0.3 µM; 300 ± 200 µM), Asn177Thr (cyan diamonds, 1.0 ± 0.2 µM; 8 ± 2 µM), and Asn177Gln (magenta inverted triangles, 1.1 ± 0.7 µM; 1.0 ± 0.5 µM). Symbols show the mean derived from n=6 and n=3 biological replicates for ibogaine and noribogaine respectively. Error bars show the s.e.m. Experiment was performed three times independently with the same results. b, Comparison of EL4 and TM1b between the x-ray ts3 paroxetine (PDB code: 5I6X, purple)28 structure and the ts2 active ibogaine outward-open cryo-EM structure (grey). Residues Tyr110 (ts2-active) and Ala110 (ts3) are shown in sticks. c, Comparison of the TM helices of the outward-open (grey), occluded (orange), and inward-open (blue) conformations viewed from the extracellular side of the membrane. The positions of TM2, 4, 5, and 12 for each conformation are shown (middle panel). The right panel shows the helical displacement measured from marker positions in each TM to a position in TM3 (Tyr186). Outward-open to occluded conformation (filled circles) and from the occluded to the inward-open conformation (open circles). The TM marker positions are described further in the ‘Methods’ section. Error bars represent the standard deviation, see Measurement section in Methods for further details. d, Comparison of the TM helices viewed from the intracellular side of the membrane. The positions of TM5, 9, 11, and 12 for each conformation are shown (middle panel). The right panel shows the helical displacement measured from marker positions in each TM to a position in TM3 (Gly160). Outward-open to occluded conformation (filled circles) and from the occluded to the inward-open conformation (open circles). Error bars represent the standard deviation. e, Angular changes of TMs associated with transition from the outward-open to the occluded conformation (filled circles) and from the occluded to the inward-open conformation (open circles). Error bars represent the standard deviation. f, The intracellular region of TM5 ‘unwinds’ in the inward-open conformation. Gly278 and Pro288 in the GX9P motif are shown in sticks. g, Alignment of TM5 of SERT, DAT, and NET with LeuT and MhsT. The position of the GX9P motif is indicated. h, Comparison of the extracellular loops 3, 4, and 6 in the outward-open (grey), the occluded (orange), and the inward-open (blue) conformations.