
Figure 3. Ibogaine binding site and conformational changes upon isomerization from the outward-open to the occluded and inward-open states.
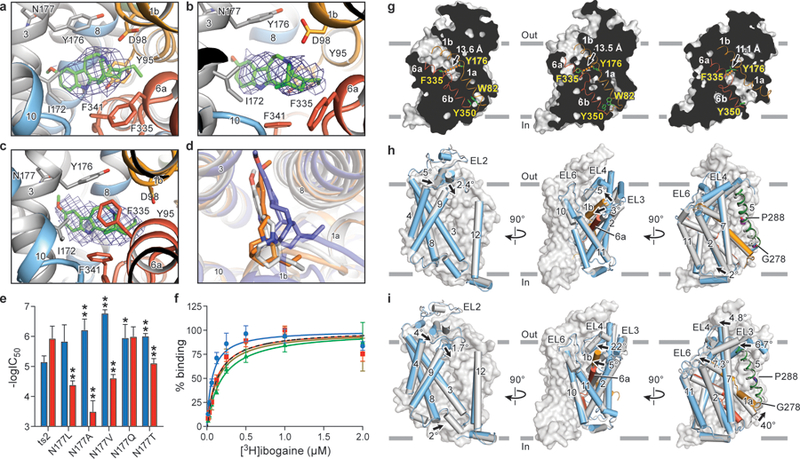
Poses of ibogaine (green) from molecular dynamics studies in the a, outward-open, b, occluded, and c, inward-open conformations. d, Comparison of ibogaine binding poses in outward-open (grey), occluded (orange) and inward-open (blue) conformations. e, The −logIC50 of each mutant for inhibition of uptake for ibogaine (blue) or noribogaine (red) is shown. The mean −logIC50 was determined using the curves in Extended Data Fig. 8a with the error of the fit (s.e.m.) shown. *P < 0.05; **P < 0.01, One-sided student’s t-test. f, [3H]-ibogaine saturation binding experiments of Asn177 mutants in 100 mM KCl, and the corresponding mean Kd values determined using the curves with the error of fit (s.e.m.): Asn177Val (blue circles, 70 ± 20 nM), Asn177Ala (red squares, 130 ± 40 nM), Asn177Thr (green triangles, 200 ± 20 nM), and Asn177Gln (olive inverted triangles, 140 ± 50 nM); binding of [3H]-ibogaine to ts2-active (dotted line) from Figure 1c is shown for comparison. Symbols show the mean derived from n=6 biological replicates. Error bars show the s.e.m. Experiment was performed five times independently with the same results. g, ‘Slab’ views of the extracellular and intracellular cavities in the outward-open (left panel), occluded (middle panel) and inward-open conformations (right panel). TM1 and TM6 are shown as cartoon representations and are orange and red, respectively. Residues defining the extracellular and intracellular gate are in sticks. The distance between extracellular (F335 and Y176) and intracellular gating residues (Y350 and W82) is shown. h, Comparison of the occluded and outward-open (grey) conformations. i, Superposition of inward-open and occluded (grey) conformations.