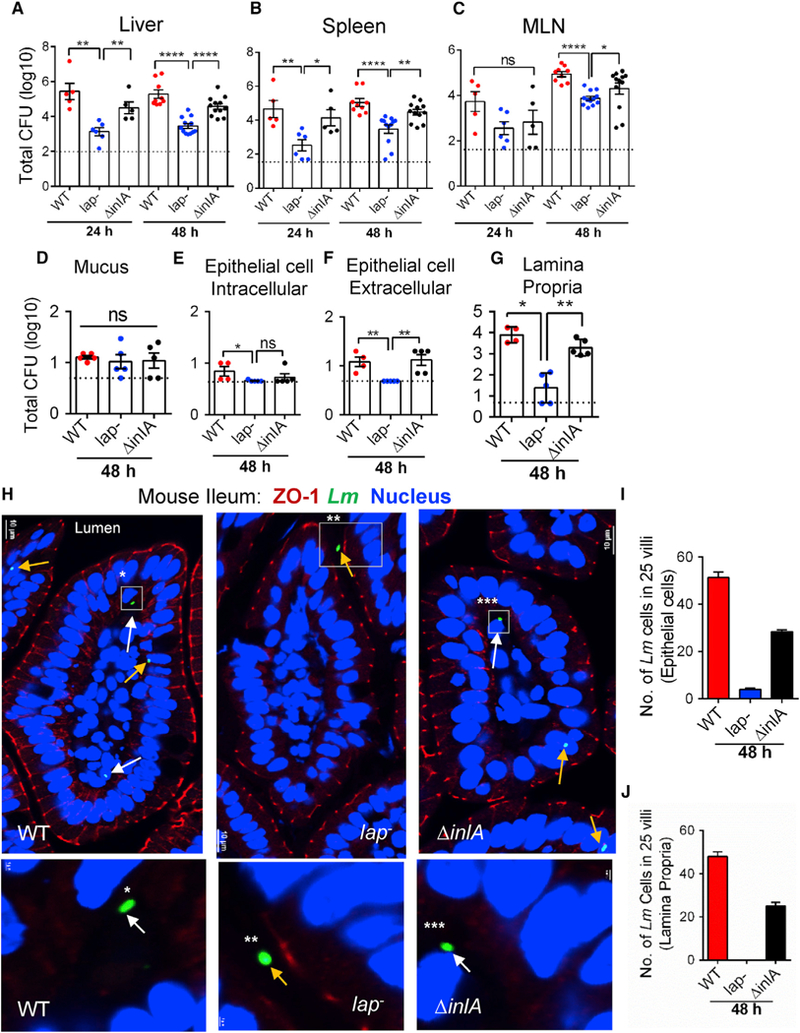
Figure 1. LAP Contributes L. monocytogenes Translocation across the Intestinal Barrier and Systemic Dissemination.

(A–G) Listeria counts (Total CFU) in liver (A), spleen (B), MLN (C), ileal mucus (D), epithelial cell intracellular (E), epithelial cell extracellular (F), and lamina propria (G) of A/J mice (n = 4–12) at 24 and 48 hr pi from three independent experiments. Dashed horizontal lines indicate the detection limit.
(H) Images of ileal villi (48 hr pi) stained for ZO-1 (red), L. monocytogenes (Lm) (green, arrows), and nucleus (blue). Scale bar, 10 μm. The panels below are enlargements of the boxed areas. Scale bar, 1 μm. White arrows indicate bacteria in the lamina propria and yellow arrows on the epithelial cells or in the lumen.
(I and J) Lm counts from epithelial cells (I) and lamina propria (J) of villi images (n = 75) from three mice for each treatment.
See also Figure S1. All error bars represent SEM. ****p < 0.0001; **p < 0.01; *p < 0.05; ns, no significance.
