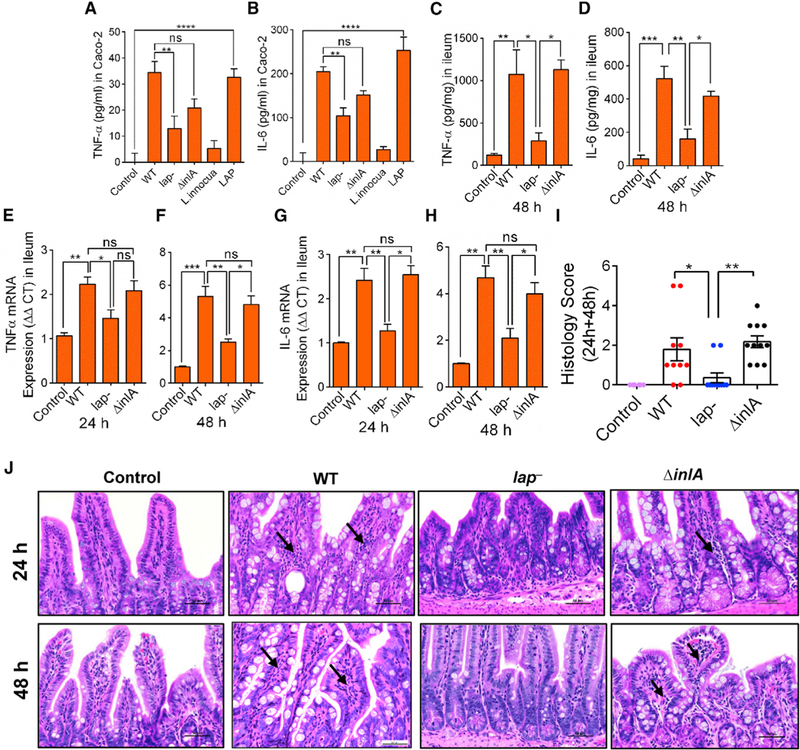
Figure 3. LAP Upregulates TNF-α and IL-6 Expression in Intestinal Cells.

(A–D) ELISA analysis of human TNF-α (A) and IL-6 (B) in Caco-2 cell supernatants (n = 4–6), and mouse TNF-α (C) and IL-6 (D) in mouse (n = 3–4) ileal tissues, at 48 hr pi. L. innocua (nonpathogen) and the purified LAP (1 μg/mL) were used as controls (A and B).
(E–H) mRNA levels for TNF-α at 24 (E) and 48 hr pi (F) and IL-6 at 24 (G) and 48 hr pi (H) in the ileal mucosa of mice (n = 3–4). Values were normalized to gapdh with the average for untreated samples set at 1.
(I and J) Histology score of ileal sections at combined 24 and 48 hr pi (I) and representative hematoxylin and eosin (H&E)-stained images (J) (scale bar, 50 mm) from control uninfected mice (n = 6) or Listeria-infected mice (n = 10–11). Polymorphonuclear and mononuclear cells (arrows) infiltrating the base of the villous lamina propria are evident (J).
See also Figure S3 and Table S1. All error bars represent SEM. ****p < 0.0001; ***p < 0.001; **p < 0.01; *p < 0.05; ns, no significance.
