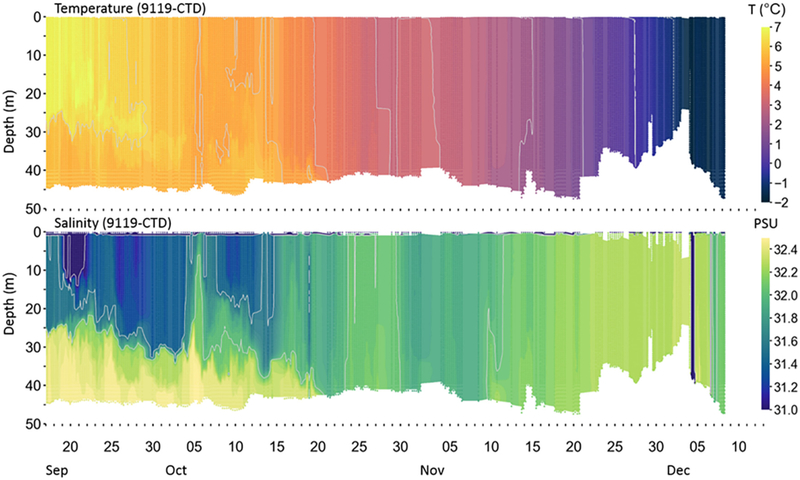
FIGURE 2 ∣.
Temperature and salinity profiles collected by ALAMO 9119-CTD from September 17 to December 8, 2017. The float began sampling near 167W, 70N and the last profile was near 165W, 72N. See: https://www.pmel.noaa.gov/arctic-heat/ for more information, including the float track.

