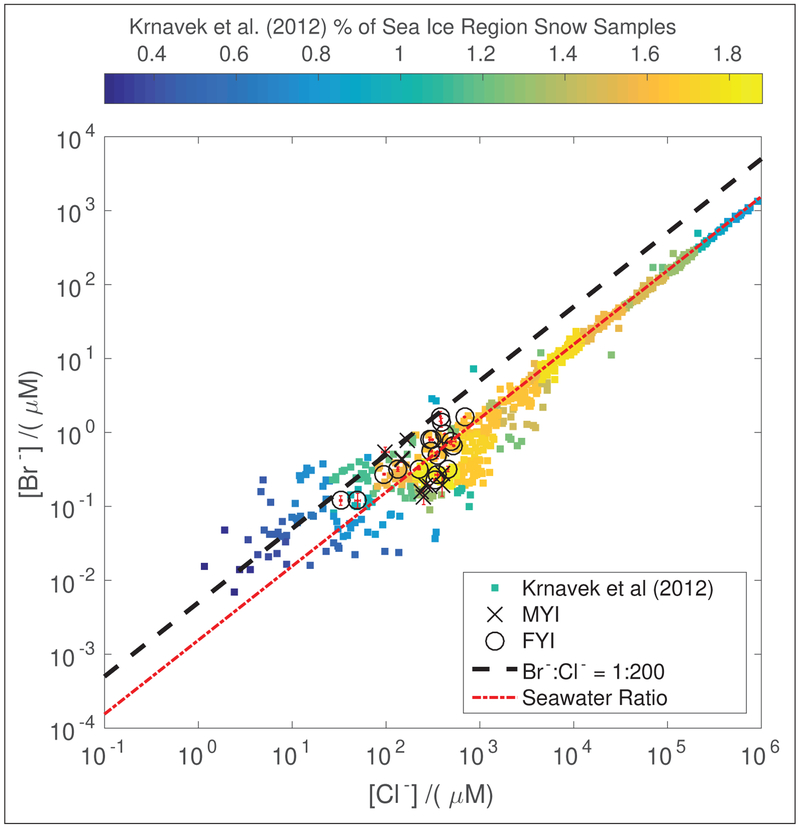
Figure 2:
Snow meltwater bromide (Br−) and chloride (Cl−) concentrations for each sample grouped by the ice region where the sample was collected. Concentration uncertainties are calculated using the standard deviation of triplicate IC measurements and plotted in red. The seawater bromide to chloride mole ratio (Millero et al., 2008) is plotted in red for reference. The black line indicates the approximate minimum ratio of bromide to chloride for efficient snowpack Br2 production in prior studies (Pratt et al., 2013). To provide context for these data, snow sample concentrations in FYI and MYI regions north of Alaska previously presented by Krnavek et al. (2012) are shown. The Krnavek et al. (2012) data are colored by the percentage of observations, with more commonly measured concentrations plotted in yellow and less common concentrations plotted in blue. DOI: https://doi.org/10.1525/elementa.352.f2

