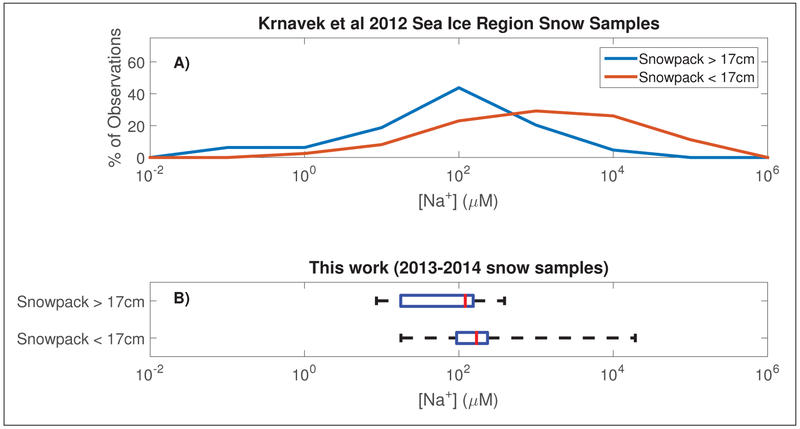
Figure 3:
Distributions of snow salinity as represented by sodium concentrations are shown for A) the surface snow samples collected by Krnavek et al. (2012) and B) the 29 samples collected in this work. In panel B, the red line represents the median, the blue box is the inner two quartiles, and whiskers span the outer two quartiles. The cut-point of 17 cm was chosen based on the upper limit depth at which brine wicking minimally influences surface snow salinity (Domine et al., 2004). DOI: https://doi.org/10.1525/elementa.352.f3

