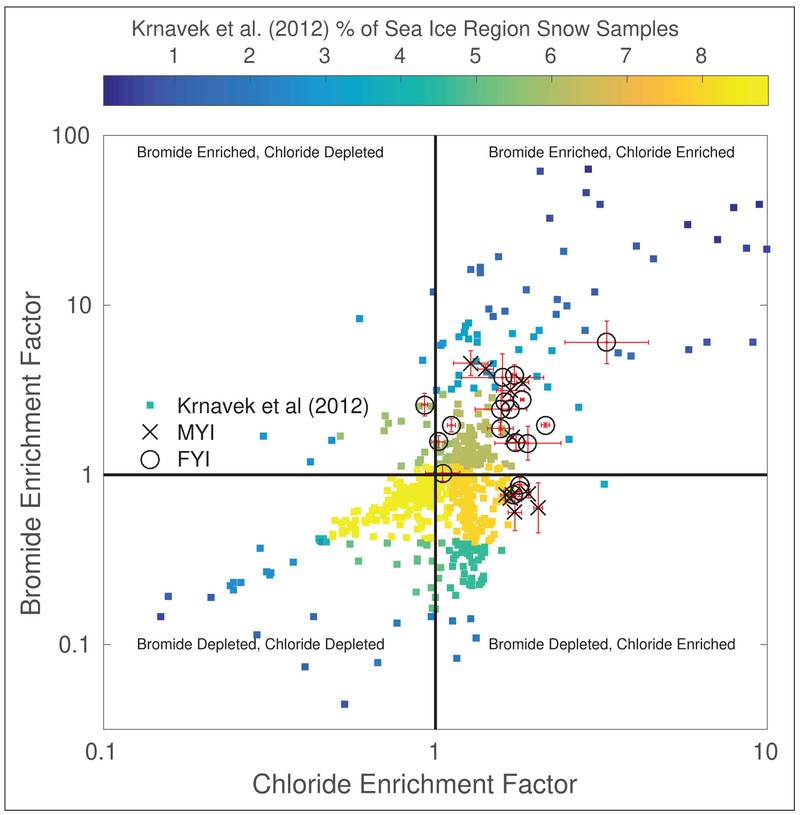
Figure 4:
Enrichment factors relative to seawater for bromide and chloride for each snow sample, grouped by the ice region where the sample was collected, and also showing snow samples collected in sea ice regions north of Alaska (Krnavek et al., 2012). Enrichment factors greater than one indicate enrichment relative to seawater, while values lower than one indicate depletion relative to seawater. The scatter plot is divided into four regimes based on enrichment of the two ions relative to seawater. Uncertainties in enrichment factors, calculated from standard deviations of triplicate IC measurements of a single sample, are plotted in red. The Krnavek et al. (2012) data are colored by the percentage of observations, with more commonly observed enrichment factors plotted in yellow and less common enrichment factors plotted in blue. DOI: https://doi.org/10.1525/elementa.352.f4

