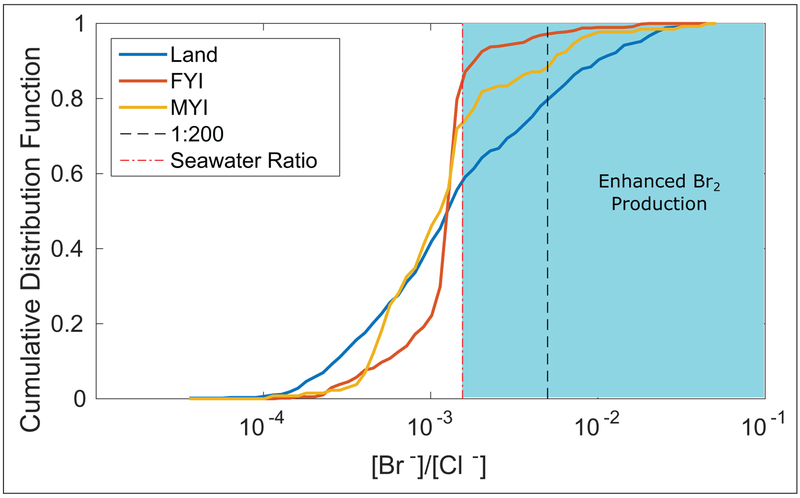
Figure 5:
Cumulative distribution functions calculated from the Krnavek et al. (2012) dataset for Br−/Cl− mole ratios in snow collected over land (blue), FYI regions (red), and MYI regions (yellow). The dashed red line denotes the sea water ratio (Millero et al., 2008) of these anions, and the black line denotes a ratio of 1:200, which has been observed as optimal for Br2 production (Pratt et al., 2013), in agreement with laboratory studies by (Huff and Abbatt, 2002; Adams et al., 2002; Sjostedt and Abbatt, 2008) showing bromide enrichment is required for Br2 production. DOI: https://doi.org/10.1525/elementa.352.f5

