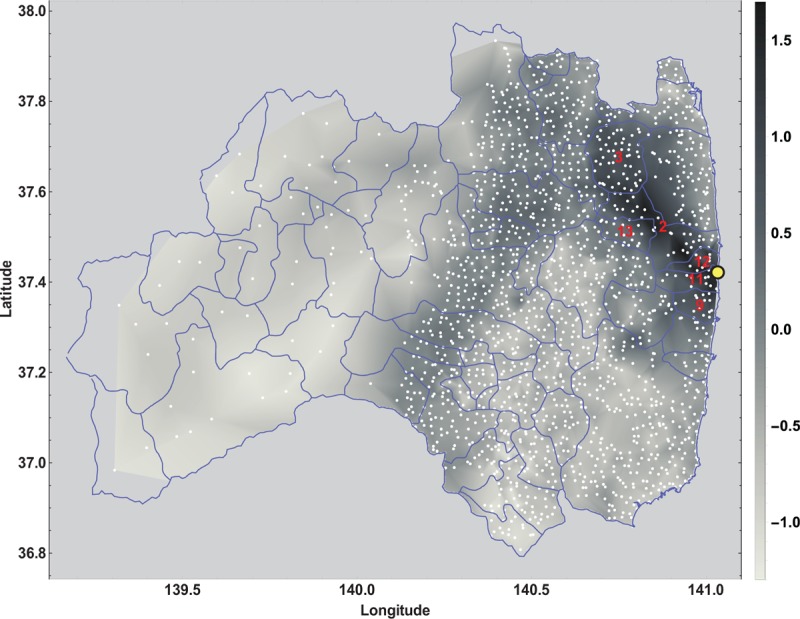
Figure 4.

Contour plot of the dose-rate [μSv/h] on a log10 gray level scale for 1710 dose-rate measurements taken at locations (white dots) in the Fukushima prefecture in June 2011; the red indexed municipalities are subject to an average dose-rate of greater than 2.0 μSv/h, see the UNSCEAR 2013 report.[68]
